Have we reached the bottom?
Whether the market has reached the bottom or is heading towards a bottom is a question of fundamental importance. It is through understanding the markets' direction that investors can make sensible choices and minimise their risk.
In attempting to figure out whether the market has bottomed, there are a few indicators which may point us toward an answer.
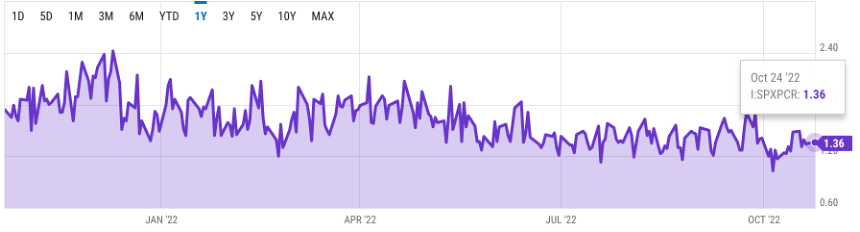
The put/call ratio holds utility when considering market sentiment. This ratio, in essence, looks at the number of puts in comparison to call options ordered. The ratio over the last month on the SPX is 1.35 which showcases the bearish underpinnings of the market. As such, it lends weight to the view that we are heading towards a bottom for if the alternative case were true, the ration would be less than 1, that is to say, there would be more calls ordered than puts which would indicate bullishness.
Liquidity is also an important consideration when it comes to understanding market direction. Notably, investors raised cash levels to 6.3% which is the highest since April '01. This showcases that investors think there is a likelihood of a recession and are wishing to be liquid consequently. There are talks, however, another bear rally is possible if U.S. Treasury yields stay at <4% and potentially a rally into H1'23 when Fed cuts become consensus.
The liquidity backdrop is still not conducive to positive market returns. The rate-of-change for spreads on junk bonds remains elevated and financial conditions continue to deteriorate at levels that signify a high crash risk. Moreover, 10 year yields are 2 standard deviations above their 12-month average - indicating that investors are opting for more high-risk investments perhaps to cover the pinch they feel from the current economic conditions.
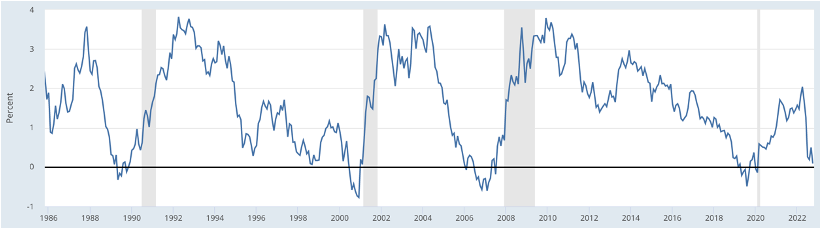
Moreover, the 10-year treasury constant maturity minus the 3-month constant maturity has been accurate 100% of the time in predicting a recession. Currently, it appears we are trending towards the recession line.
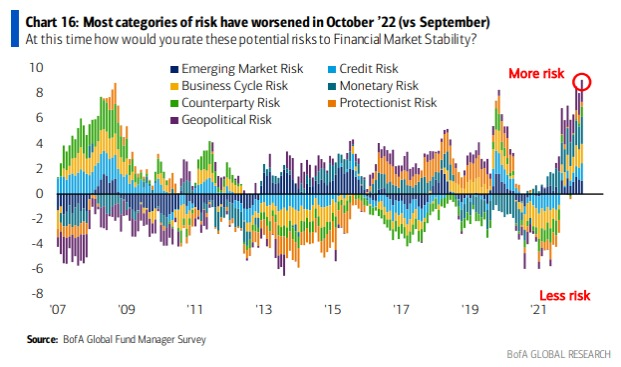
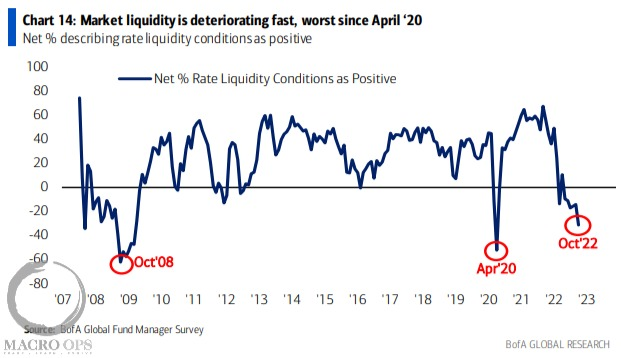
Compounding investors' concerns about a recession is the fact that the risk 'categories' are rising while liquidity is deteriorating at a troubling rate. In Chart 16 (see below), provided by the BofA bund, we see how the categories of risk are at the same '08 and '20 levels. Correlated with this increased risk is the fast deterioration of market liquidity to levels seen during '08 and '20 (see Chart 14 below). This is a clear sign that the market is trending towards a bottom, rather than making a recovery.
Substantiating the view that a recession is imminent is seen through the recession probability models by Bloomberg which have forecasted a 100% chance of a recession by October 2023. This is up from the 65% probability for the comparable period in the previous update.
The strong likelihood of further investor capitulation reinforces the probability of a recession as the FMS financial market stability risk metrics are at an all-time high. This is largely the product of increased monetary and credit concerns.
The so-called 'pinch' Americans are starting to feel is clearly substantiated through consideration of credit. As it stands, households despite opting to be liquid don't have much of it and are thereby forced to tap credit cards to fill the gap between living costs and incomes.
The New York Fed Reserve reported that credit card debt surged by $46 billion in the second quarter as consumers struggle to compete with the cost of living.
The Fed is trying hard to bring down inflation; however, their long-term goal will be scrambling to fix what they have broken: economic actors.
Notably, the fundamental detail of this recession is the fact it is Fed-induced which stands in contrast to the recessions of 2002 and 2008, turning the economic playbook into a complete theory.
So, do you think we are heading towards a recession?
To keep up with the latest finance, tech, crypto and geopolitical news, subscribe to our mailing list.
[Disclaimer: The material across our site is provided for informative purposes only and does not contain investment advice.]
Subscribe to our newsletter
Disclaimer: This article does not constitute financial advice nor a recommendation to invest in the securities listed. The information presented is intended to be of a factual nature only. Past performance is not a reliable indicator of future performance. As always, do your own research and consider seeking financial, legal and taxation advice before investing.