
America’s Mounting Debt: What a Rising U.S. Deficit Could Mean for Markets

At the current pace, total debt is expected to surpass USD 39 trillion within months, with the next trillion likely to follow within a similar timeframe. The rate of accumulation is significant in scale and notable for persisting outside of a recessionary environment.
While trillion-dollar figures can appear abstract, the per capita impact provides clearer context. The increase over the past year alone equates to approximately USD 6,900 per American, or USD 17,400 per household. In aggregate, gross federal debt now stands at around USD 113,000 per person, or more than USD 286,000 per household.
Although the Joint Economic Committee’s release is presented as a factual data update rather than policy commentary, the implications are broader. For global financial markets and for Australian investors allocating capital internationally, these figures help frame the evolving backdrop for interest rates, equity valuations and currency dynamics.
The Number Everyone Knew Was Coming
There has been little surprise in the direction of U.S. federal debt. The upward trajectory has been evident for years. The latest data from the Joint Economic Committee confirms not only continuation, but acceleration.
Five years ago, total gross federal debt was approximately USD 10.70 trillion lower than it is today. At that time, the average interest rate on marketable U.S. debt stood at just 1.541%. Today, that average rate has risen to 3.348%. On the surface, the shift may appear incremental. Applied to a debt base of more than USD 38 trillion, however, the compounding effect is substantial.
Over the past twelve months, net interest payments to government trust funds alone totalled USD 251.76 billion, or close to USD 21 billion per month. Overall net interest costs have nearly tripled over the past five years, reflecting both higher rates and a materially larger debt stock.
Looking ahead, projections from the Congressional Budget Office indicate that net interest will account for 13.85% of total federal outlays in FY2026, rising to 14.52% by FY2028. In practical terms, the United States is approaching a point where servicing existing debt absorbs a share of expenditure comparable to several core government functions.
Put differently, nearly USD 21 billion per month is directed toward interest payments to trust funds before new infrastructure is commissioned, defence commitments are funded, or healthcare obligations are met.
What’s Driving America’s Debt Surge
The current expansion in U.S. debt reflects a mix of structural and cyclical forces.
First, structural spending pressures are intensifying. Entitlement programs such as Social Security and Medicare are expanding as the U.S. population ages. Demographic trends are largely predictable yet politically difficult to reform. Defence spending and infrastructure commitments also remain elevated.
Second, tax policy decisions over the past decade have constrained revenue growth relative to expenditure. Successive administrations have enacted tax measures designed to stimulate growth or address political priorities, often without fully offsetting spending reductions.
Third, and increasingly important, is the cost of servicing the debt itself. As interest rates rose sharply following the post-pandemic inflation surge, the U.S. Treasury began refinancing maturing debt at significantly higher yields. Net interest outlays have become one of the fastest-growing components of federal expenditure. In effect, the government is now borrowing not only to fund programs, but increasingly to fund prior borrowing.
Cyclical forces have compounded the issue. Pandemic-era stimulus programs materially expanded deficits in 2020 and 2021. Although emergency measures have largely unwound, spending levels have not fully normalised relative to revenue.
From a sustainability perspective, investors focus less on the nominal USD 38 trillion figure and more on debt relative to GDP and the trajectory of annual deficits. Persistent structural deficits, rather than temporary crisis borrowing, tend to shape long-term market expectations. Current projections suggest deficits will remain elevated as a share of GDP over the coming decade absent meaningful policy reform.
The question for markets is not whether the U.S. can service its debt today. It can. The question is whether the supply of Treasuries required to fund ongoing deficits will alter interest rate dynamics and investor risk appetite over time.
What the Debt Clock Actually Means for Markets
The growing U.S. national debt is not just a headline; it has tangible implications for markets in the United States and globally. Sovereign debt can remain elevated for extended periods without triggering immediate crises. Japan has maintained a debt-to-GDP ratio above 200% for years, and the U.S. carried large deficits for much of the post-war period. There is a distinction between debt that markets are comfortable financing and debt that begins to test confidence. The United States is not in crisis, but it is entering a phase where the margin for error is narrowing.
The Interest Rate Feedback Loop
Rising deficits require continued Treasury issuance. Greater supply can place upward pressure on yields, which increases debt servicing costs, widens the deficit, and prompts additional issuance. This self-reinforcing cycle has begun to influence investor behaviour.
The return of a meaningful term premium reflects a shift in expectations for long-duration debt. Investors are more selective in their willingness to hold long-maturity Treasuries, demonstrating increased sensitivity to fiscal conditions and the broader macroeconomic environment.
Equity Markets: Short-Term Support, Long-Term Pressure
In the near term, government spending can support corporate revenues and the broader economy. Policies that boost disposable income, such as tax adjustments, can also underpin equity performance even as fiscal pressures rise.
Over the medium term, higher long-term yields act as a constraint on equity valuations. As the risk-free rate increases, the discount applied to future earnings rises, compressing price-to-earnings multiples. This effect is most pronounced for high-growth, long-duration stocks where much of the value is concentrated in earnings projected years ahead.
Historical experience underscores the potential for rapid market responses. The 2011 U.S. credit rating downgrade, triggered by a debt ceiling impasse, caused a sharp but temporary drawdown in equity markets. While markets ultimately recovered, the episode illustrates how quickly fiscal uncertainty can translate into market volatility.
The U.S. Dollar: Reserve Currency Advantages and Limits
The dollar’s status as the world’s reserve currency remains a critical buffer, supporting global demand for Treasury and dollar-denominated assets. This demand allows the U.S. to finance deficits at rates unavailable to most other countries.
However, this status is not unconditional. Persistent fiscal deterioration and political gridlock have raised questions about long-term currency stability. Central banks and sovereign wealth funds have diversified reserves and increased gold holdings as a hedge. While precautionary rather than reactive, such strategies can influence investor behaviour and asset pricing over time.
The Fed Is Caught in the Middle
One dimension of rising U.S. debt that receives less attention is its implications for the Federal Reserve. The Fed is designed to operate independently, setting monetary policy based on inflation trends and employment data rather than government financing needs. In practice, this independence can be tested when fiscal pressures intensify.
As the Treasury issues substantial volumes of debt, the Fed faces a balancing act. Allowing interest rates to rise freely would increase government borrowing costs and expand the deficit. Intervening to suppress yields, for example through bond purchases or renewed quantitative easing, could reignite inflationary pressures and risk undermining credibility.
Economists describe the extreme scenario as fiscal dominance, where monetary policy becomes subordinated to fiscal requirements. The United States is not at that point, but the trajectory warrants attention. Each percentage point increase in the average cost of debt adds hundreds of billions of dollars to annual interest payments, potentially constraining policy flexibility over time.
For investors, this dynamic underscores that U.S. fiscal policy and debt trajectories are increasingly intertwined with monetary policy, market yields, and global capital flows.
ASX Investor Implications
For Australian investors, U.S. fiscal dynamics are not a distant concern. Several channels transmit the impact directly to the ASX, influencing currencies, interest rates, commodities, and risk sentiment.
AUD/USD Exchange Rate.
Sustained U.S. dollar weakness, driven by fiscal deterioration or accommodative Fed policy, tends to support the Australian dollar. A stronger AUD can be a headwind for ASX resource exporters that earn in USD while benefiting domestically focused companies. Commodity prices, Chinese demand, and broader risk sentiment also influence the AUD, so investors should monitor these alongside U.S. fiscal trends.
Australian Bond Yields.
Movements in U.S. Treasury yields often transmit to Australian government bonds. Persistent upward pressure on U.S. 10-year yields has historically lifted Australian 10-year yields in tandem, raising the cost of capital for rate-sensitive sectors such as REITs, utilities, and infrastructure companies.
Commodities and Miners.
A weaker U.S. dollar generally supports USD-denominated commodity prices. For AUD-denominated prices, a stronger AUD can offset some gains. ASX resource companies, particularly gold producers, are positioned to benefit from strong commodity prices and safe-haven demand during periods of U.S. fiscal uncertainty.
Gold as a Hedge.
Central banks have been increasing gold holdings as a hedge against potential USD weakness and fiscal credibility risk. Persistent high-debt, high-deficit conditions reinforce the structural case for gold. ASX-listed gold producers could benefit from both rising gold prices and a more favourable cost environment.
Risk-Off Events.
U.S. fiscal catalysts such as debt ceiling standoffs, credit rating changes, or poorly received Treasury auctions can trigger global risk-off episodes. The ASX is not insulated, and Australian equities historically correlate with U.S. market volatility during acute risk periods.
RBA and Rate Divergence.
If U.S. fiscal pressures constrain the Fed from adjusting rates as expected, the Reserve Bank of Australia may diverge in policy. Rate divergence can support the AUD and influence the relative appeal of Australian fixed income versus U.S. Treasuries.
Banks and Wholesale Funding.
Australia’s major banks rely on offshore wholesale funding markets. A deterioration in global credit conditions, which can accompany U.S. fiscal stress, may increase funding costs and pressure net interest margins.
The Fiscal Reality Check
The United States’ national debt has reached USD 38.5 trillion and continues to grow at a pace that warrants attention from global investors. While the U.S. can currently service its obligations, the trajectory of deficits and interest costs is influencing Treasury supply, long-term yields, and investor risk perceptions. Markets are increasingly attentive to how fiscal dynamics affect borrowing costs, equity valuations, and currency flows.
For Australian investors, U.S. fiscal trends are directly relevant. Movements in Treasury yields, the U.S. dollar, and global risk sentiment can transmit to the ASX through bond markets, commodities, currency translation, and exposure to risk-off events. Monitoring these channels helps investors understand potential headwinds or opportunities arising from elevated U.S. deficits.
Debt alone does not trigger crises. Confidence, yield dynamics, and policy credibility shape market reactions. Awareness of these fiscal trends and their transmission channels allows investors to manage risk and position portfolios prudently without overreacting to headline figures.
Subscribe to our newsletter
Disclaimer: This article does not constitute financial advice nor a recommendation to invest in the securities listed. The information presented is intended to be of a factual nature only. Past performance is not a reliable indicator of future performance. As always, do your own research and consider seeking financial, legal and taxation advice before investing.
Speak to an Advisor
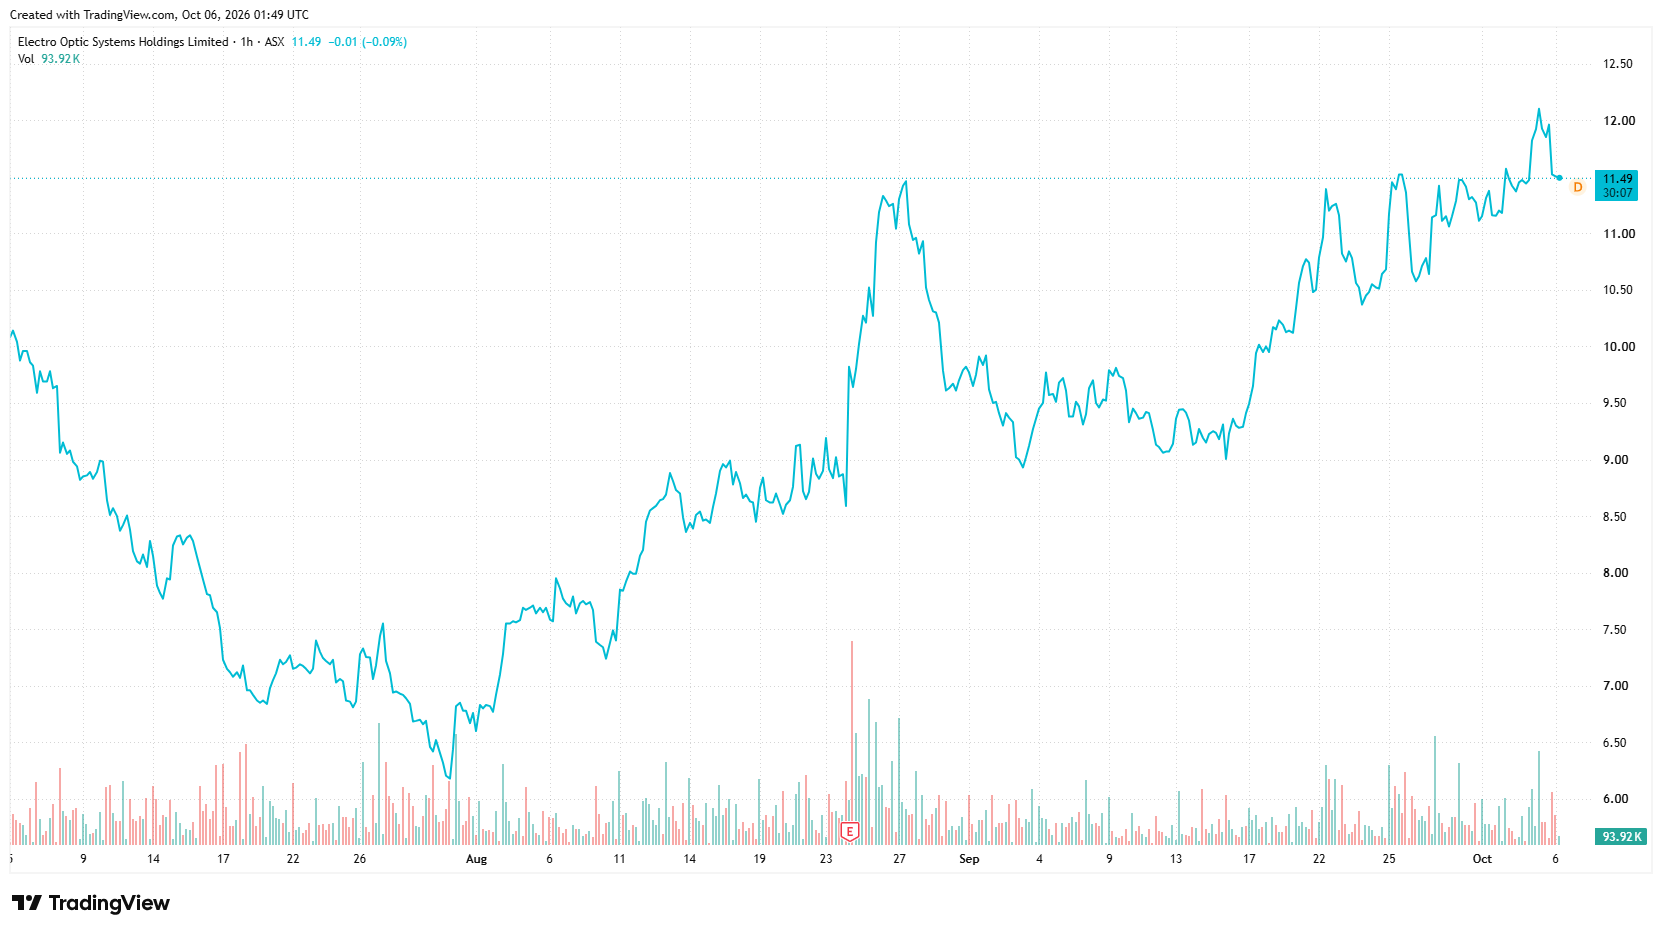
About Electro Optic Systems Holdings Ltd. Electro Optic Systems Holdings Limited engages in the development, manufacture, and sale of telescopes and dome enclosures, laser satellite tracking systems, remote weapon systems, and high laser weapon. It operates through Defense Systems and Space Systems segments. The company develops, manufactures, and markets fire control, surveillance, weapon systems, and high energy laser to military customers. It also provides passive optical and laser sensing equipment; optical, microwave and on-the-move radio and satellite products; and laser-based surveillance systems with space tracking capability. In addition, the company offers counter-drone, firepower, force protection, and UGV and marine lethality systems, as well as high energy laser weapon; optical tracking systems, space control, space domain awareness, satellite laser ranging, space sustainability, and precision optics. It operates in Australia, the United States, Singapore, the United Arab Emirates, the United Kingdom, New Zealand, the Netherlands, North America, Germany, and rest of Europe. Electro Optic Systems Holdings Limited was founded in 1983 and is based in Symonston, Australia. Source: EODHD Key Stats
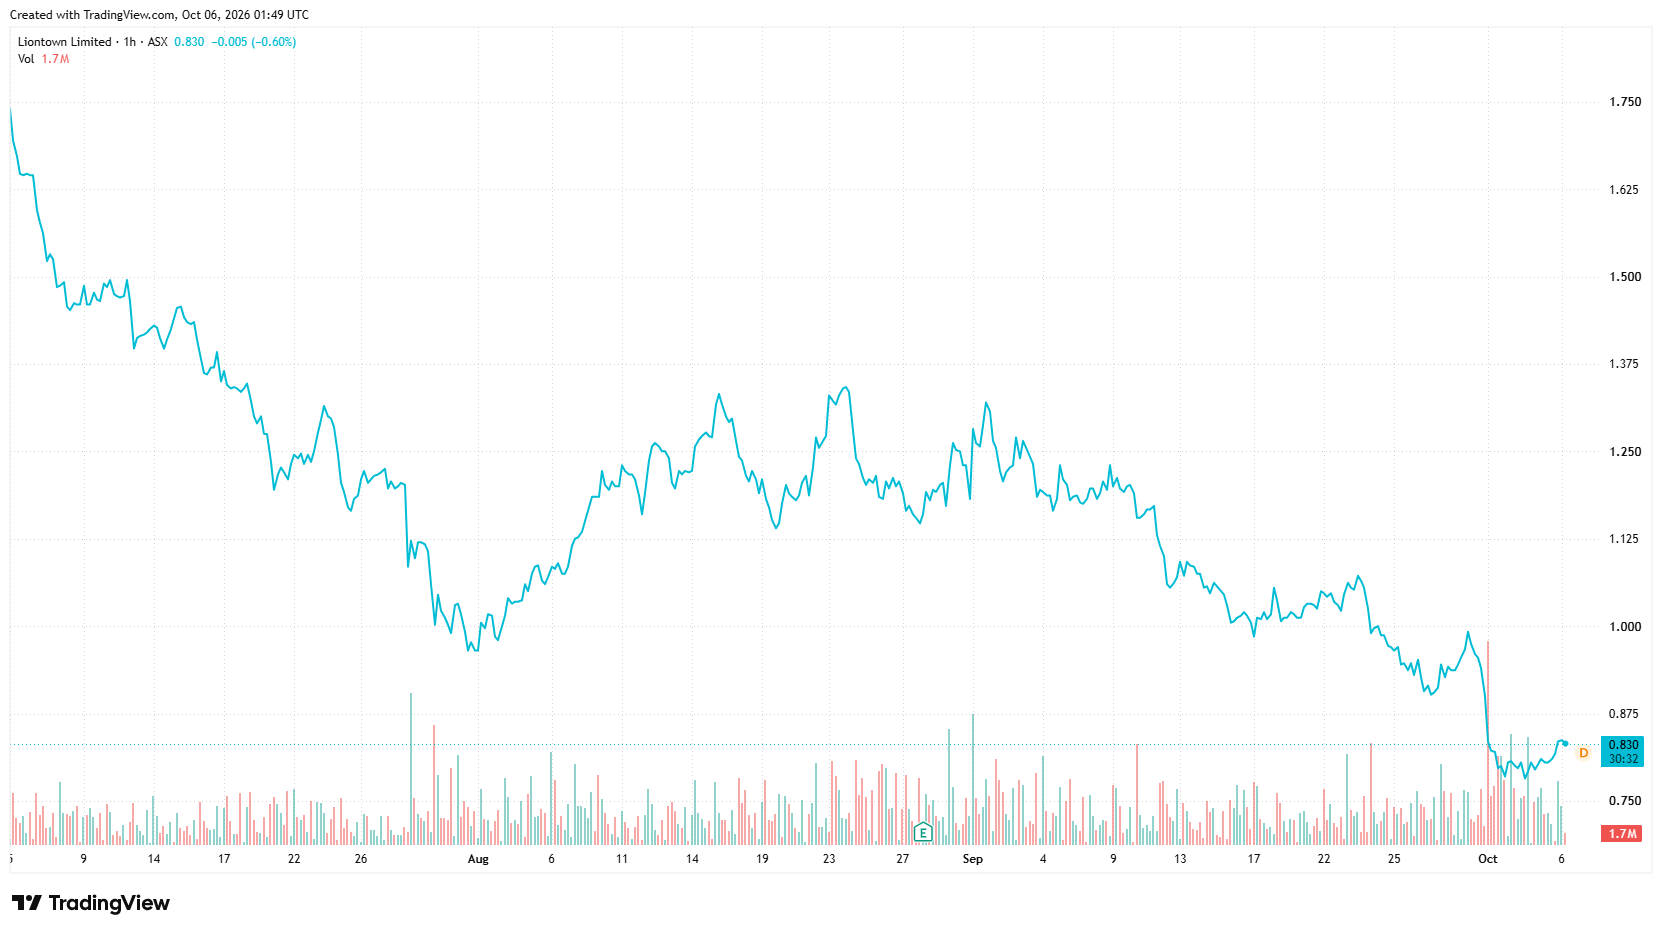
About Liontown Ltd. Liontown Limited engages in the exploration, evaluation, and development of mineral properties in Australia. It primarily explores for lithium, gold, and nickel deposits. The company's flagship property is the Kathleen Valley lithium project located in Perth, Western Australia. The company was formerly known as Liontown Resources Limited and change its name to Liontown Limited in November 2025. Liontown Limited was incorporated in 2006 and is headquartered in West Perth, Australia. Source: EODHD Key Stats

The RBA has raised rates to 4.60% as inflation pressures persist. Explore the impact of energy costs, AI demand and the key signals investors should watch next.

Discover how advances in genomics, AI, diagnostics and gene editing are creating a broader healthcare opportunity and where commercial value is emerging.

The AI trade is being forced to rethink the pace of progress. Here is what investors should watch across Nvidia, chips, AI spending, software and adoption.

Copper is at a record high, yet the global market still has a surplus. So where is all the copper, and why is it becoming harder to find?

Sharewise CEO Alex Perry sat down with ausbiz to unpack how the platform approached FY26, a year in which it reported an ASX return of almost 11% and a US return above 32%. The conversation ranged from the AI infrastructure theme to specific names on Perry's radar in resources and quantum computing. Here's a rundown of the key points.

Warsh gave markets a framework, not a forecast. What his first Jackson Hole keynote means for inflation, rates, forward guidance and the outlook for equities.
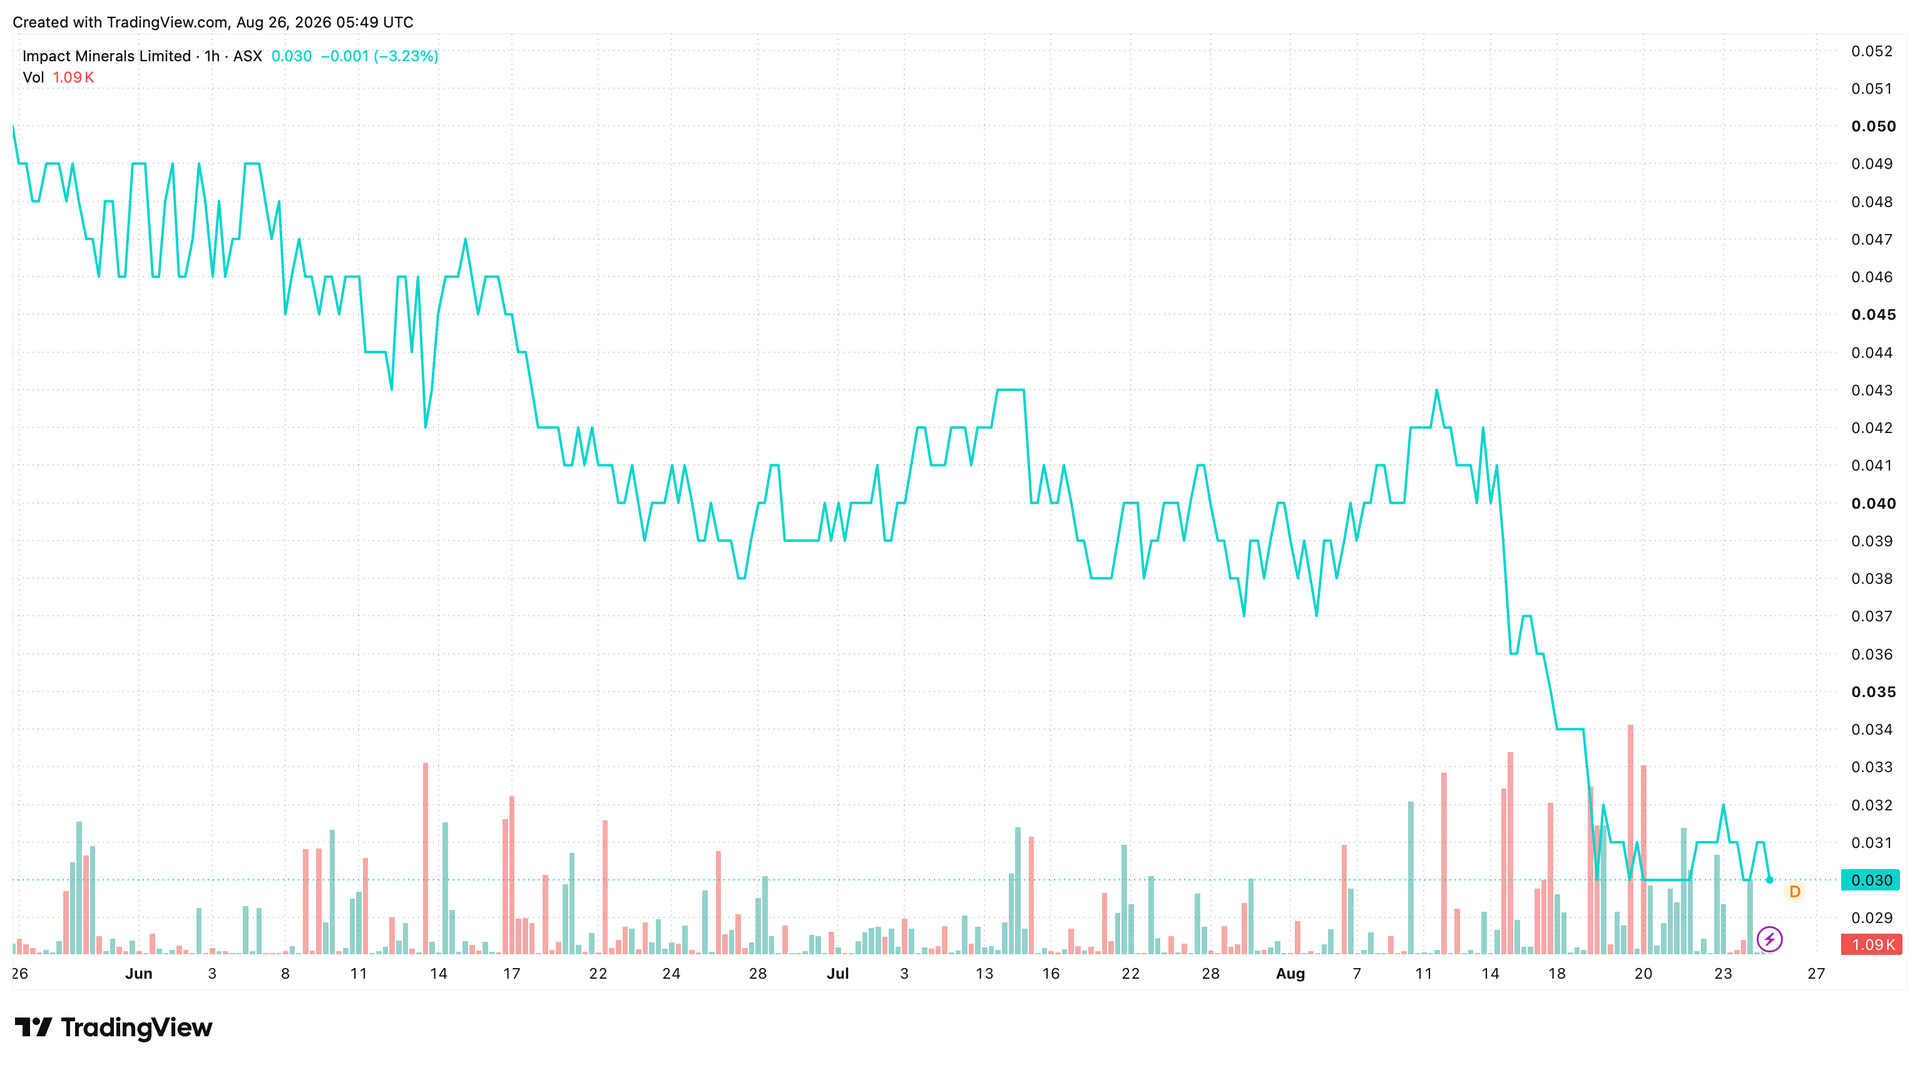
Get the latest on Impact Minerals (ASX: IPT), including stock performance, technical analysis, forecasts & key insights. See if IPO supports your goals.
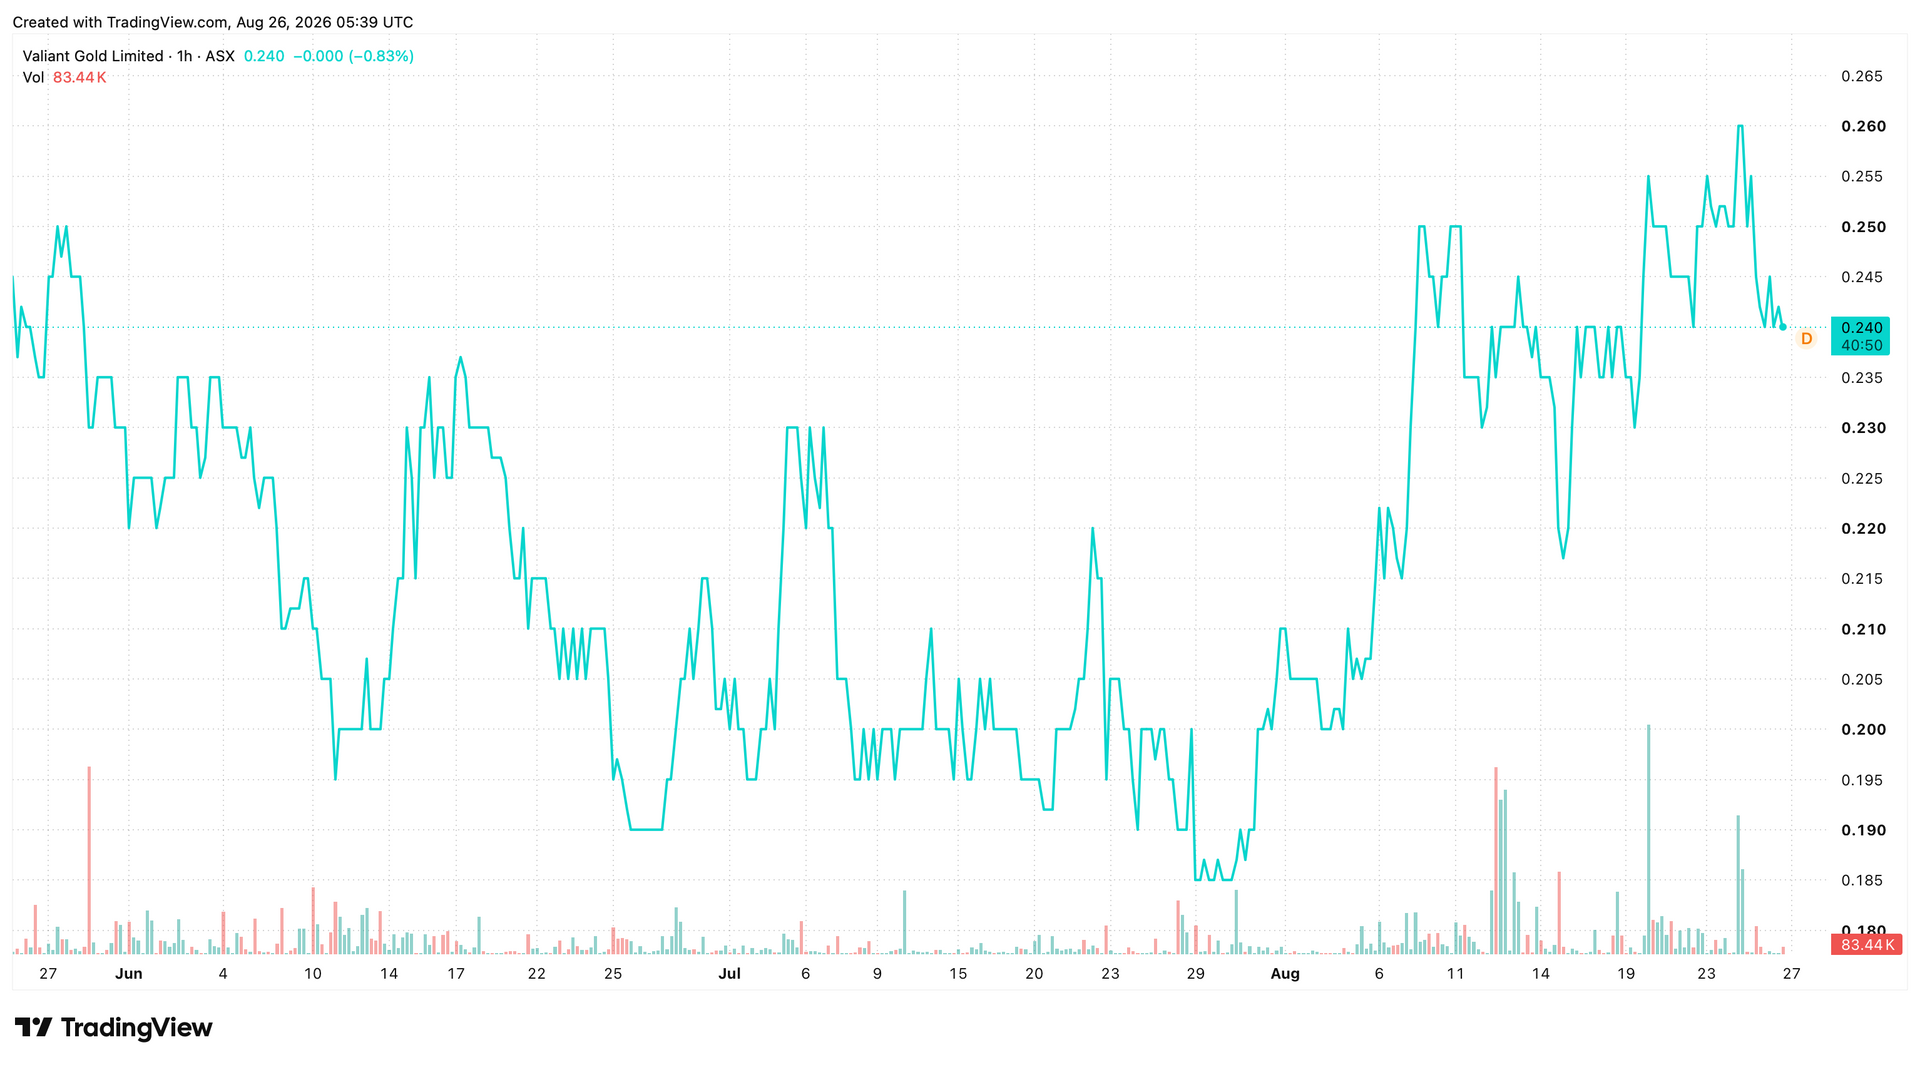
Get the latest on Valiant Gold (ASX: VAL) with our share price, technical analysis, forecasts & key insights. See if this ASX gold stock fits your investment goals.
