The Cold War for Chips – How the U.S.–China Tech Battle Is Reshaping Global Markets
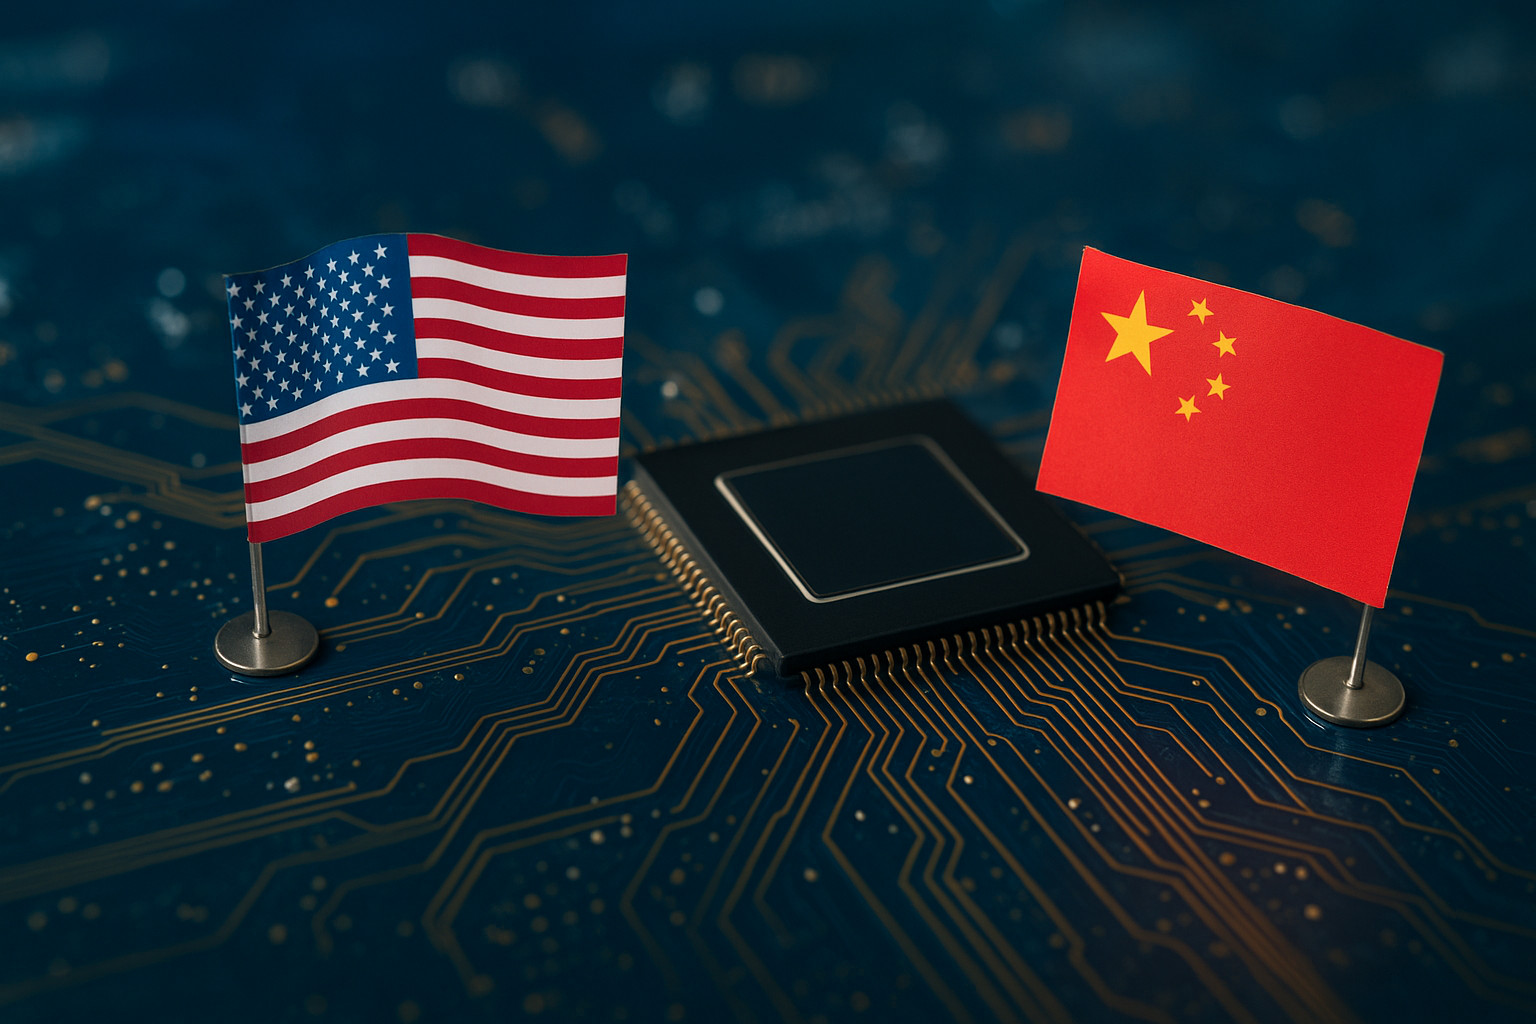
Semiconductors are no longer just the backbone of consumer electronics. They have become a strategic resource shaping artificial intelligence, cloud infrastructure, defence systems and advanced manufacturing. Technology now defines national competitiveness, and the relationship between the United States and China has shifted from commercial rivalry to a contest centred on control of chip technology. What began as a race for manufacturing efficiency is now a geopolitical struggle with far-reaching implications for global capital flows, supply chains and market leadership. Investors monitoring these developments must understand how technology, infrastructure and policy intersect to shape long-term opportunities.
Where the Battle Is Being Fought in the Semiconductor Supply Chain
Competition between the U.S. and China is concentrated along three critical layers of the semiconductor value chain. The first is chip design. U.S. firms such as NVIDIA, AMD, Arm and Apple dominate high-end AI accelerators, edge processors and data-centre architectures. Their intellectual property ensures they remain essential to the global computing roadmap. These designs underpin frontier AI development, advanced defence systems and industrial automation, making design leadership a strategic chokepoint that China cannot easily replicate.
Fabrication is the second battleground. Taiwan, led by TSMC, remains the world’s most advanced producer of cutting-edge chips. Its leadership at 3 nanometres, with plans for 2 nanometres, places it at the centre of geopolitical attention. No alternative producer matches its scale or technical capability, creating strategic dependence and concentration risk. South Korea plays a similarly critical role in memory and advanced logic production. Any disruption in these hubs would have immediate consequences for cloud computing, AI development and broader digital infrastructure.
The third layer is semiconductor manufacturing equipment, which represents the industrial hard power of the sector. ASML, Applied Materials, Tokyo Electron and Lam Research control the lithography, deposition and etching tools required to build advanced chips. Because these firms operate in U.S.-aligned economies, the U.S. can restrict China’s access to key equipment. Limits on EUV and advanced DUV systems have slowed China’s progress at the frontier and highlight how manufacturing equipment has become one of the most strategically influential parts of the supply chain.
U.S. Strategy: Containment Through Technology Denial
The U.S. has adopted a containment strategy that uses technology access as a strategic lever. Export controls introduced since 2022 restrict China’s access to advanced GPUs, lithography platforms and specialised design software, aiming to limit China’s capabilities in frontier AI models and high-performance computing. Companies have been required to modify products or withdraw them entirely from China when performance thresholds exceed the controlled limits.
This approach is reinforced by domestic investment. The CHIPS and Science Act allocates more than USD 50 billion to expand U.S. fabrication, strengthen advanced packaging and accelerate R&D. The goal is to rebuild strategic elements of the supply chain, reduce reliance on overseas foundries and maintain U.S. leadership in defence-relevant technologies.
Alliance alignment strengthens this strategy. Japan and the Netherlands control essential lithography and materials technologies, while Taiwan and South Korea provide global leading-edge manufacturing capacity. Through coordinated export controls, the U.S. has expanded the reach of its restrictions and increased the effectiveness of its containment effort.
China’s Countermove: Self-Sufficiency and Import Substitution
China has accelerated its goal of building a domestic semiconductor ecosystem capable of operating independently from U.S. influence. National and provincial programs have committed an estimated USD 150–200 billion to expand fabrication, strengthen memory production, support local design houses and build domestic equipment capability. Progress at 28 and 40 nanometres has been significant, enabling China to scale output for automotive, industrial and consumer applications.
Still, China remains several generations behind at the leading edge. EUV systems remain inaccessible due to export restrictions, and domestic alternatives are not yet competitive. China is developing its own AI accelerators to replace restricted U.S. chips, but performance gaps persist. At the same time, China is also strengthening ties with regions willing to expand technology cooperation, including parts of Southeast Asia and the Middle East. The long-term aim is an end-to-end semiconductor supply chain that can function independently of foreign pressure.
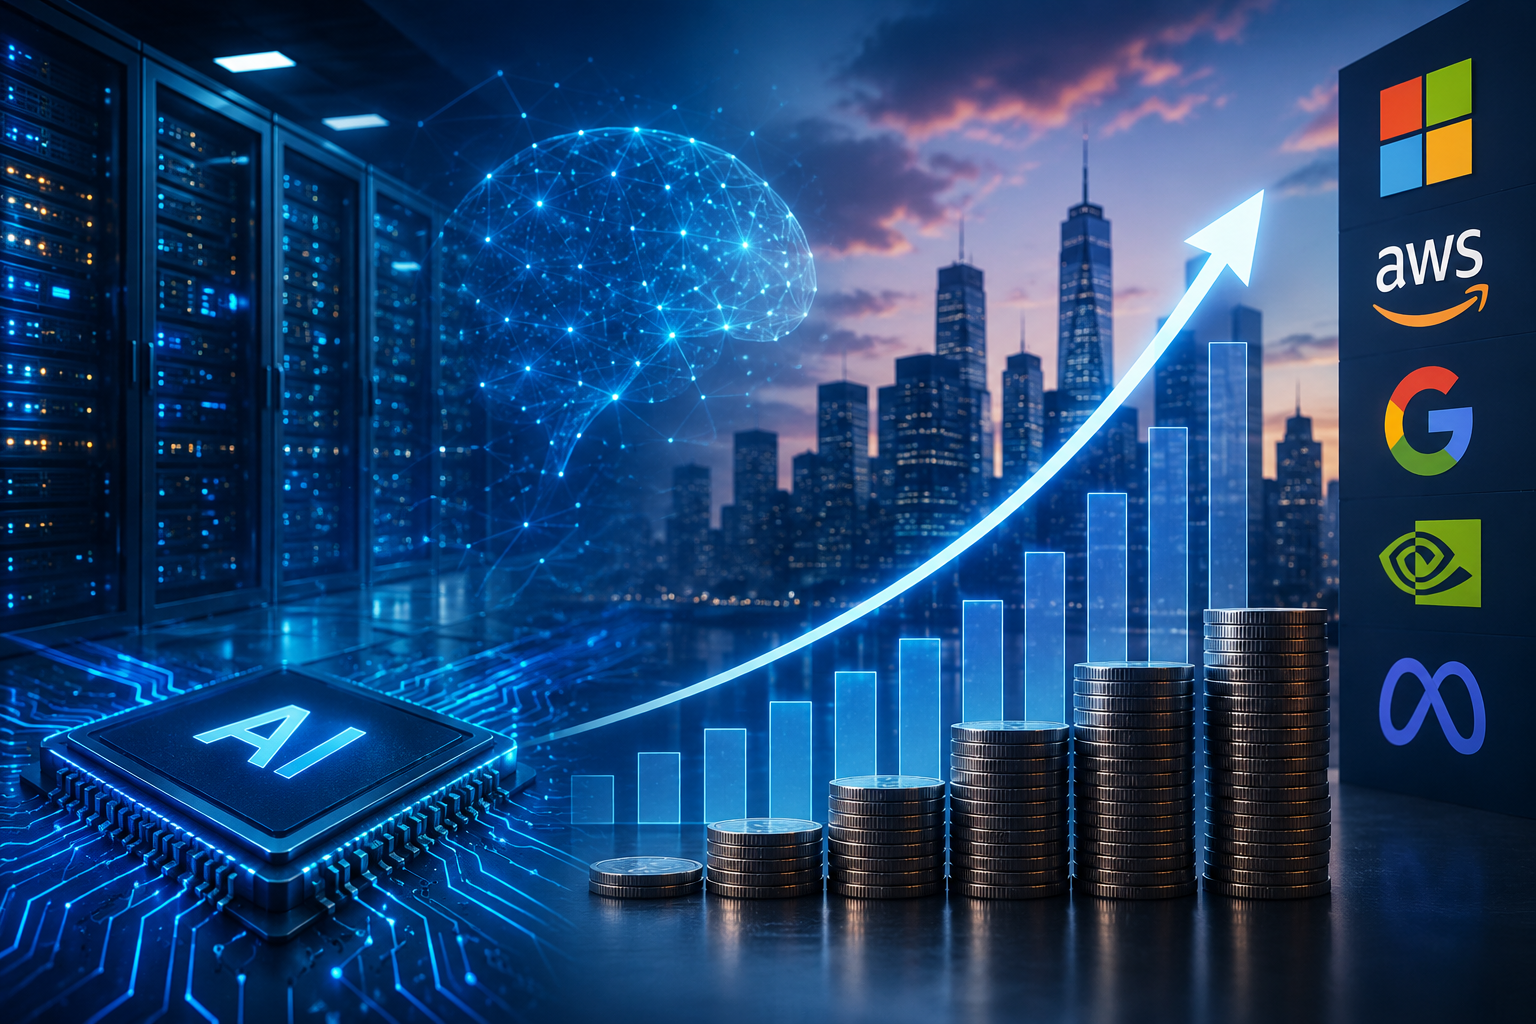
The AI Power Bottleneck: Data Centres, Energy and Infrastructure Limits
The rapid growth of AI is creating a new constraint across the semiconductor ecosystem: data-centre power and infrastructure capacity. Global electricity demand from data centres is forecast to more than double by 2030, reaching around 945 TWh annually, with AI servers contributing nearly half of this growth. In the U.S., data-centre electricity usage is expected to rise 165% by 2030 relative to 2023, and by 2035, peak power demand linked to AI workloads may exceed 100 GW. These figures highlight how quickly power availability and grid readiness are becoming limiting factors.
AI workloads also require far more energy- and cooling-intensive infrastructure. GPU-optimised racks typically draw 40–60 kW, with high-density configurations surpassing 100 kW. This places pressure on electricity grids, substation buildouts, water usage and permitting processes. As a result, the constraints around AI deployment are shifting from chip availability to data-centre readiness. Regions with flexible power supply and supportive regulatory frameworks may capture a greater share of AI investment, while areas facing energy bottlenecks could experience delays in hardware deployment and uneven semiconductor demand.
Market Implications: Winners and Losers
The evolving semiconductor landscape is creating differentiated opportunities and risks. U.S. chip designers and memory suppliers are benefiting from strong AI-driven demand, with GPU accelerators, high-bandwidth memory and advanced packaging in multi-year expansion cycles. Equipment suppliers across Europe, Japan and the United States are also well positioned, supported by global capex expected to reach USD 374 billion between 2026 and 2028. China is seeing selective growth in mature-node fabrication, memory and domestic AI accelerators as it accelerates import substitution.
Pressure points are emerging as well. Rapid investment in mature-node capacity raises the risk of oversupply in 28 and 40 nanometre nodes by 2026, which could compress margins for Chinese foundries. Companies with significant exposure to China, or whose products sit near export-control thresholds, face regulatory uncertainty and higher compliance costs. Taiwan and South Korea remain essential to leading-edge production but carry heightened geopolitical sensitivity due to their strategic position in the supply chain.
The AI power bottleneck introduces a new layer of market divergence. Even as chip supply improves, AI hardware deployment may become uneven across regions depending on power availability and infrastructure readiness. Markets with favourable energy policy and grid capacity may see accelerated semiconductor demand, while constrained regions risk slower rollouts. This dynamic is shaping competitive positioning across the industry.
Investor Considerations
Two themes are likely to guide investor positioning. The first is supply-chain resilience. Companies with diversified manufacturing across the United States, Japan, South Korea, India and Southeast Asia are better insulated from policy shocks and geopolitical tension. Those concentrated in a single high-risk region face greater exposure to delays, regulatory intervention and restricted access to advanced technologies.
The second theme is the rise of two distinct technology ecosystems. As U.S. and Chinese standards diverge, companies operating in both markets must redesign products, navigate complex compliance requirements and adapt their long-term strategies. Firms that adjust early may secure stronger competitive positions, while those slow to respond may lose market access.
Semiconductor equipment suppliers remain a structural growth opportunity. Governments and corporations are expanding fabrication capacity, driving sustained demand for lithography, etching, metrology and packaging tools. The scale-up of AI infrastructure reinforces this demand, particularly in high-bandwidth memory, GPU accelerators and advanced packaging.
Investors should also monitor constraints outside chip manufacturing. AI data centres are increasingly limited by power availability, cooling capacity and network infrastructure. These bottlenecks may influence hardware demand and shape semiconductor supply-demand dynamics.
Conclusion
The U.S.–China semiconductor conflict has transformed chips from a specialised industry into a strategic asset affecting national security, energy planning and global market behaviour. Both countries are vying for leadership in AI and advanced manufacturing, directing capital toward regions and companies with genuine technological depth, resilient supply chains and infrastructure capable of supporting accelerating AI demand.
Over the next decade, the emergence of parallel technology ecosystems, sustained investment in AI infrastructure, and energy capacity expansion will redefine global market leadership. Understanding how geopolitics, power constraints and semiconductor capabilities interact will be central to long-term investment positioning. Regions with favourable policy, robust infrastructure and leading-edge technology will likely capture a disproportionate share of AI-driven growth, shaping competitive and financial outcomes well beyond 2030.
Subscribe to our newsletter
Disclaimer: This article does not constitute financial advice nor a recommendation to invest in the securities listed. The information presented is intended to be of a factual nature only. Past performance is not a reliable indicator of future performance. As always, do your own research and consider seeking financial, legal and taxation advice before investing.
AI spending is accelerating in 2026. Learn how to read AI earnings, spot overhyped stocks and find companies converting AI investment into real profit.

Wall Street posted its strongest quarter since 2020. Discover what's driving the rally, why the US outperformed the ASX, and what it means for Australian investors.
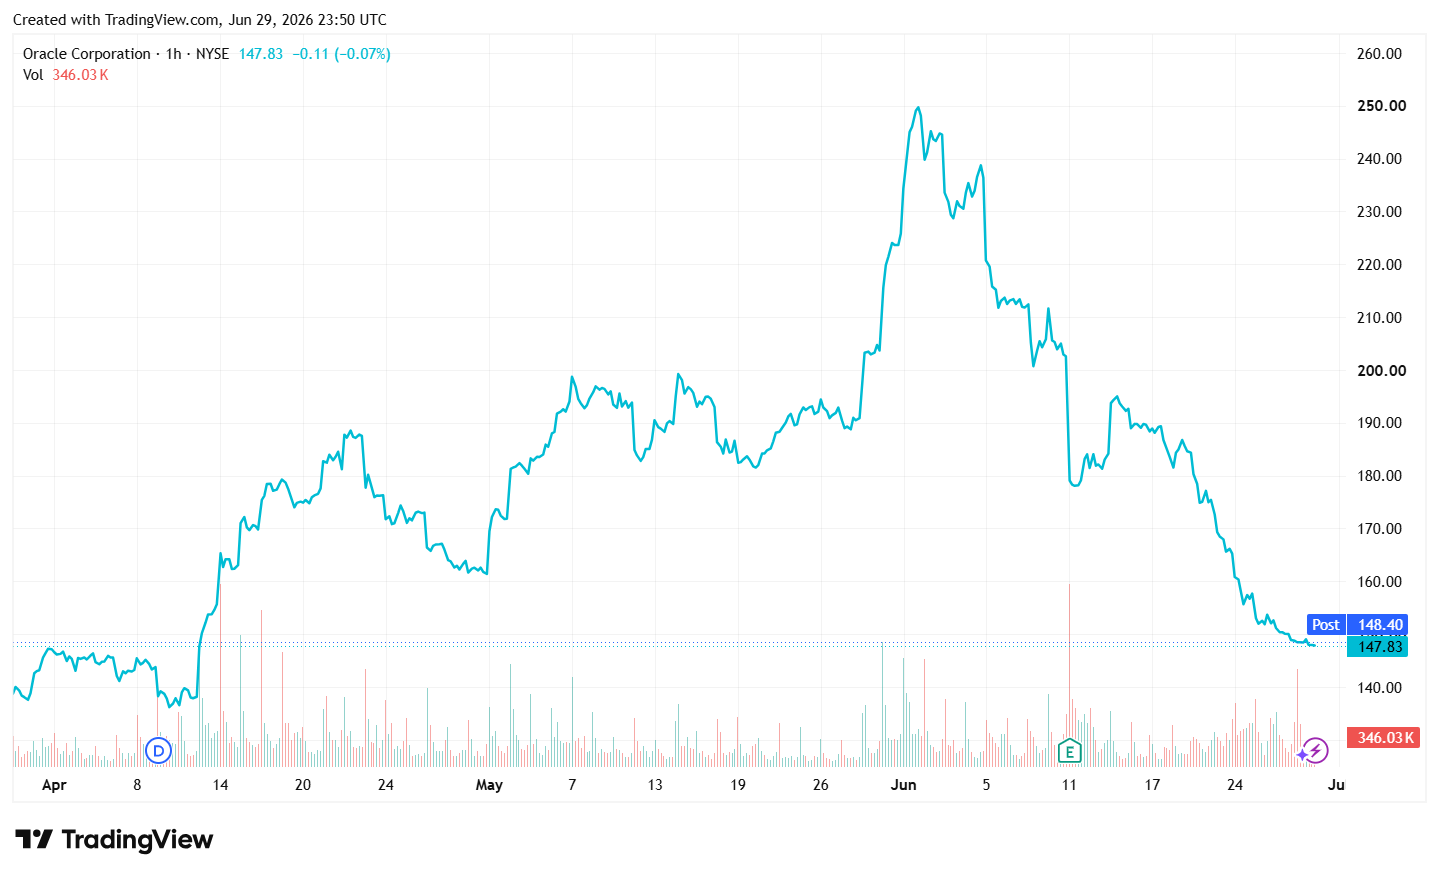
About Oracle Corporation Oracle Corporation offers products and services that build, run and support enterprise information technology frameworks worldwide. Its Oracle cloud software as a service offering includes various cloud software applications, including Oracle Fusion cloud enterprise resource planning ERP, Oracle Fusion cloud enterprise performance management EPM, Oracle Fusion cloud supply chain and manufacturing management SCM, Oracle Fusion cloud human capital management HCM, and NetSuite applications suite, Oracle Health applications, as well as Oracle Fusion Sales, Service, and Marketing. The company also offers cloud-based industry solutions for various industries; Oracle cloud license and on-premise license; and Oracle license support services. In addition, it provides cloud and license business' infrastructure technologies, such as the Oracle Database and MySQL Database; Java, a software development language; and middleware, including development tools and others. The company's cloud and license business' infrastructure technologies also comprise cloud-based compute, storage, and networking capabilities; and Oracle autonomous database, as well as AI, Internet-of-Things, machine learning, digital assistant, and blockchain. Further, it provides hardware products and other hardware-related software offerings, including Oracle engineered systems, enterprise servers, storage solutions, industry-specific hardware, virtualization software, operating systems, management software, and related hardware support services, and consulting and advanced customer services. It markets and sells its cloud, license, hardware, support, and services offerings directly to businesses in various industries, government agencies, and educational institutions, as well as through indirect channels. Oracle Corporation has a strategic alliance with Metron, Inc. The company was founded in 1977 and is headquartered in Austin, Texas. Source: EODHD Key Stats
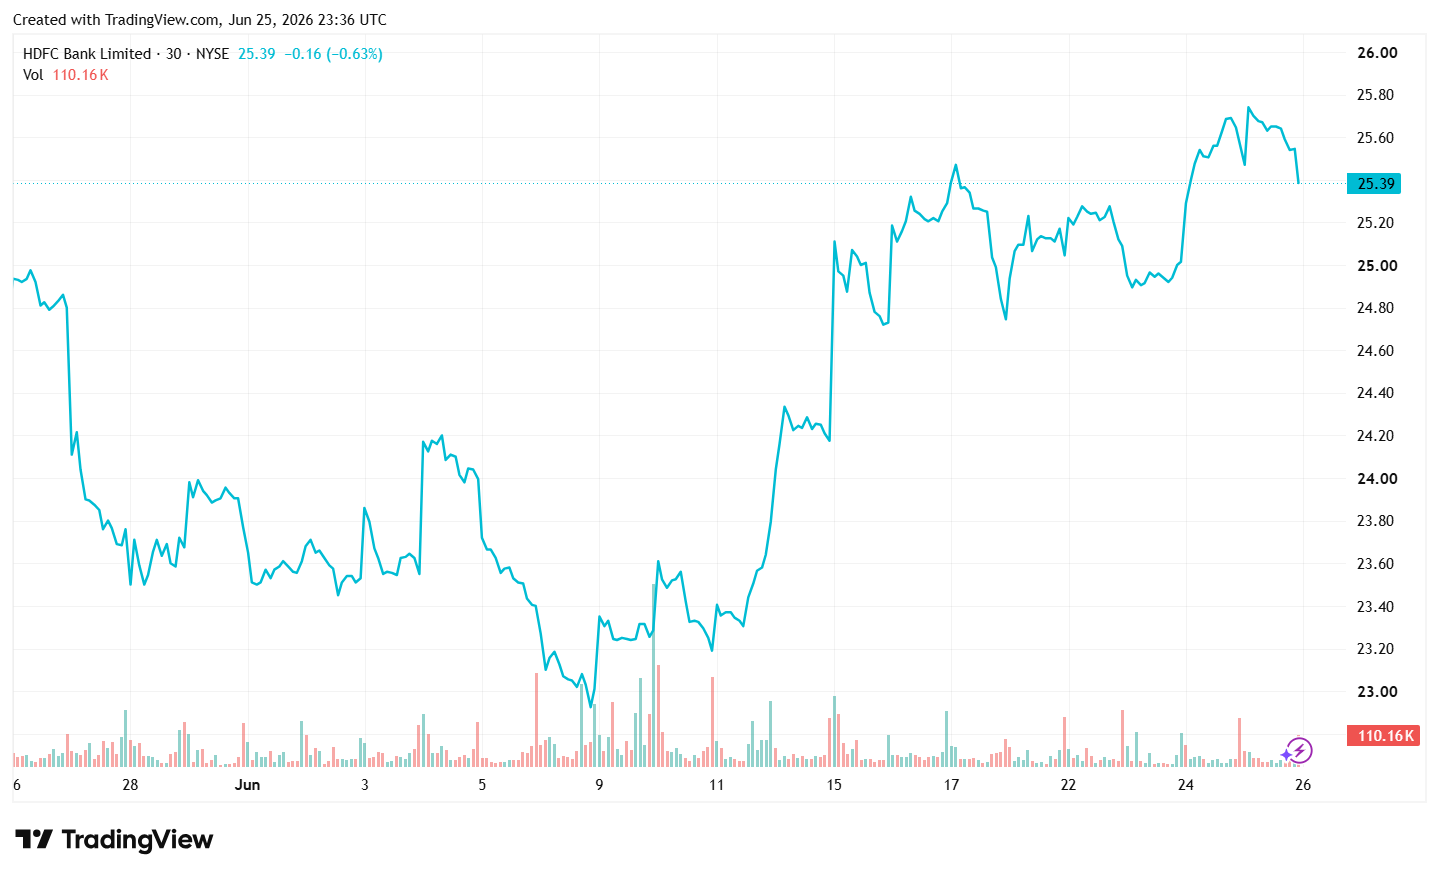
About HDFC Bank Limited HDFC Bank Limited provides banking and financial products and services to individuals and businesses in India, Bahrain, Hong Kong, Singapore, and Dubai. The company operates through Treasury, Retail Banking, Wholesale Banking, Other Banking Business, Insurance Business, and Other segments. It offers savings, salary, current, rural, public provident fund, pension, and demat accounts; fixed and recurring deposits; and safe deposit lockers, as well as offshore accounts and deposits, and overdrafts against fixed deposits. The company also provides personal, home, car, two-wheeler, business, doctor, educational, gold, consumer, and rural loans; loans against properties, securities, mutual funds, rental receivables, and assets; loans for professionals; government sponsored programs; and loans on credit card, as well as working capital and commercial/construction equipment finance, healthcare/medical equipment, commercial vehicle finance, dealer finance, and term loans. In addition, it offers credit, debit, prepaid, forex, and kisan gold cards; payment and collection, export, import, remittance, bank guarantee, letter of credit, trade, hedging, and merchant and cash management services; and insurance and investment products. Further, the company provides short term finance, bill discounting, structured finance, export credit, loan repayment, custodial, and documents collection services; online, mobile, and phone banking services; unified payment interface, immediate payment, national electronic funds transfer, and real time gross settlement services; channel financing, vendor financing, reimbursement account, money market, derivatives, employee trusts, cash surplus corporates, tax payment, and bankers to rights/public issue services; and financial solutions for supply chain partners and agricultural customers. It operates branches and automated teller machines in various cities/towns. The company was incorporated in 1994 and is headquartered in Mumbai, India. Source: EODHD Key Stats
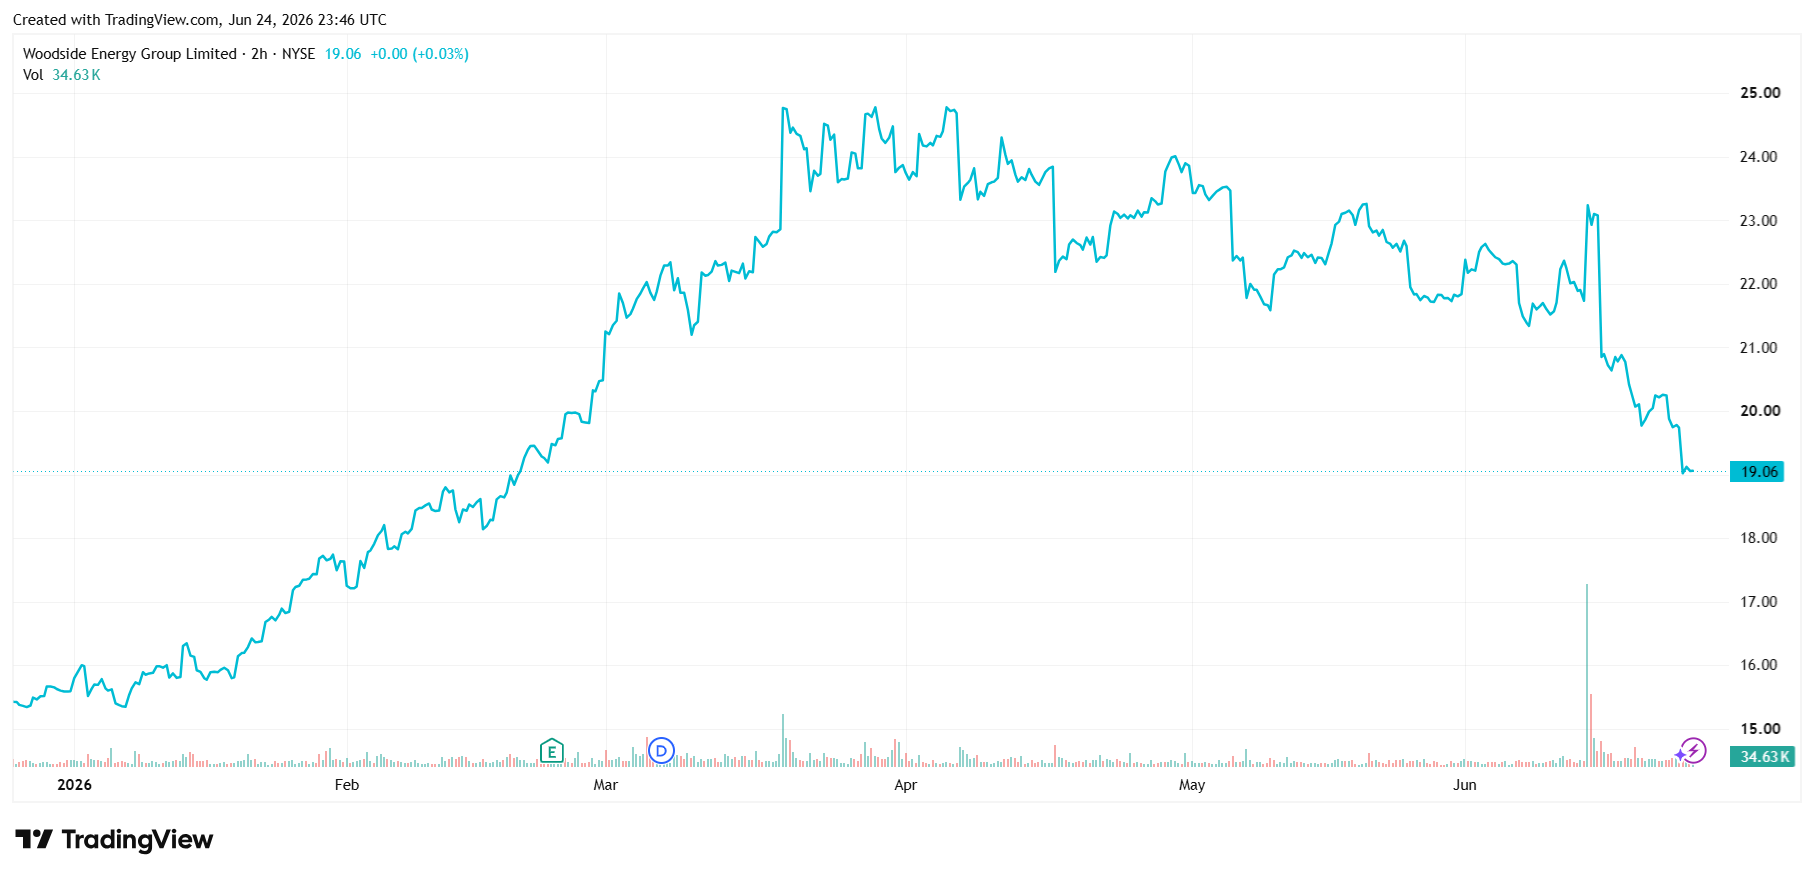
About Woodside Energy Group Woodside Energy Group Ltd engages in the exploration, evaluation, development, production, marketing, and sale of hydrocarbons in the Asia Pacific, Africa, the Americas, and the Europe. It produces liquefied natural gas, pipeline gas, crude oil and condensate, and natural gas liquids. The company holds interests in the Pluto LNG, North West Shelf, Wheatstone and Julimar-Brunello, Bass Strait, Ngujima-Yin FPSO, Okha FPSO, Pyrenees FPSO, Macedon, Shenzi, Mad dog, Greater Angostura, as well as Scarborough, Sangomar, Trion, Calypso, Browse, Liard, Ruby, Sangomar, Atlantis, Woodside Solar opportunity, and Sunrise and Troubadour. It is also involved in the development of new energy products and lower-carbon services. The company was formerly known as Woodside Petroleum Ltd and changed its name to Woodside Energy Group Ltd in May 2022. Woodside Energy Group Ltd was founded in 1954 and is headquartered in Perth, Australia. Source: EODHD Key Stats
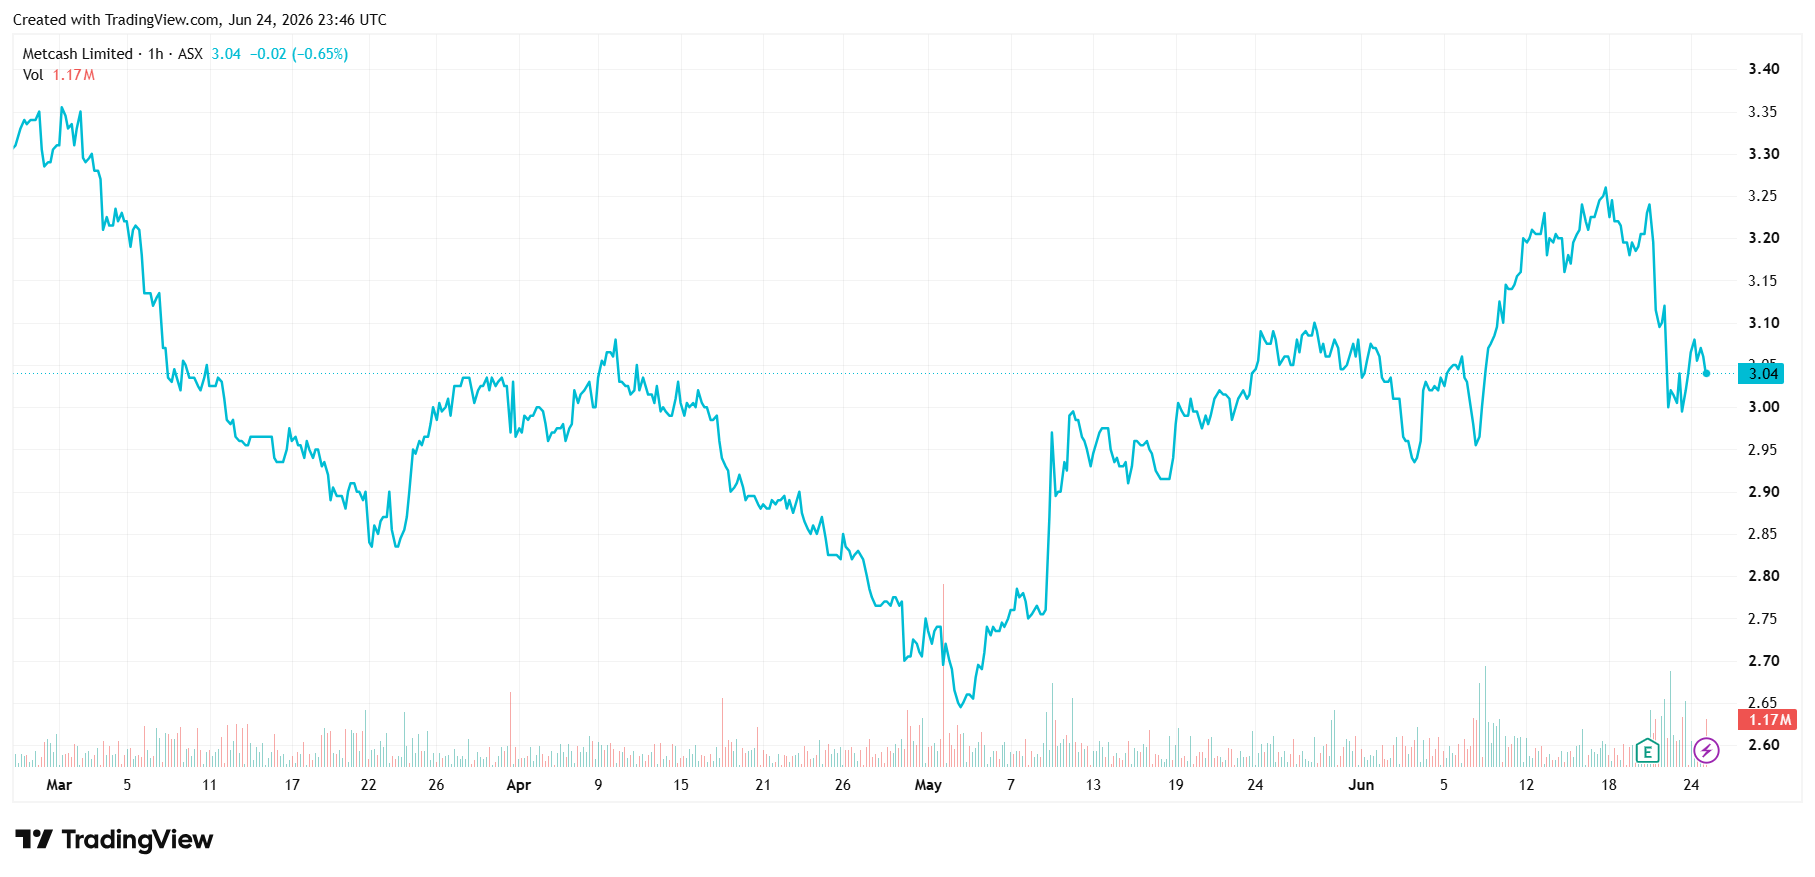
About Metcash Ltd Metcash Limited operates as a wholesale and distribution company in Australia. The company operates through Food, Liquor, and Hardware segments. Its Food segment distributes a range of products and services to independent supermarket, convenience retail outlets, and food service customers. The Liquor segment engages in the distribution of liquor products to independent retail outlets and hotels. Its Hardware segment distributes hardware products to independent retail outlets; and operates company owned retail stores. The company sells its products under the IGA, Foodland, Mitre 10, Home Hardware, Total Tools, Cellarbrations, IGA Liquor, and the Bottle-O brand names. Metcash Limited was founded in 1927 and is based in Macquarie Park, Australia. Source: EODHD Key Stats

SMSFs can no longer borrow to buy residential property. A clear look at what changed, the 45-day window to act, and what it means for your retirement strategy.
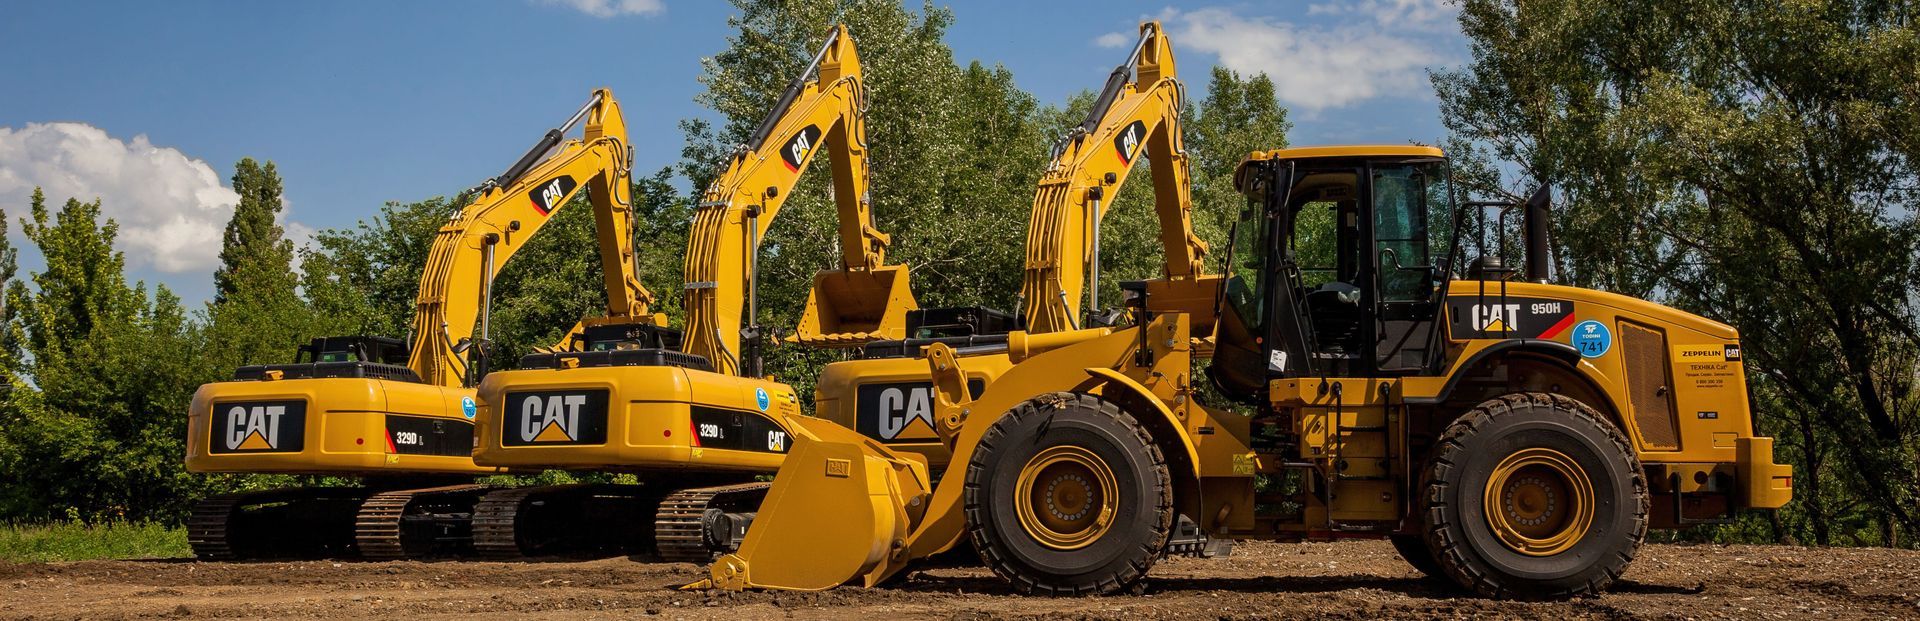
What made RPMGlobal (ASX: RUL) worth $1.1B to Caterpillar? Explore the SaaS transition, the 5-year hold & the long-term ASX investing lessons from this deal.
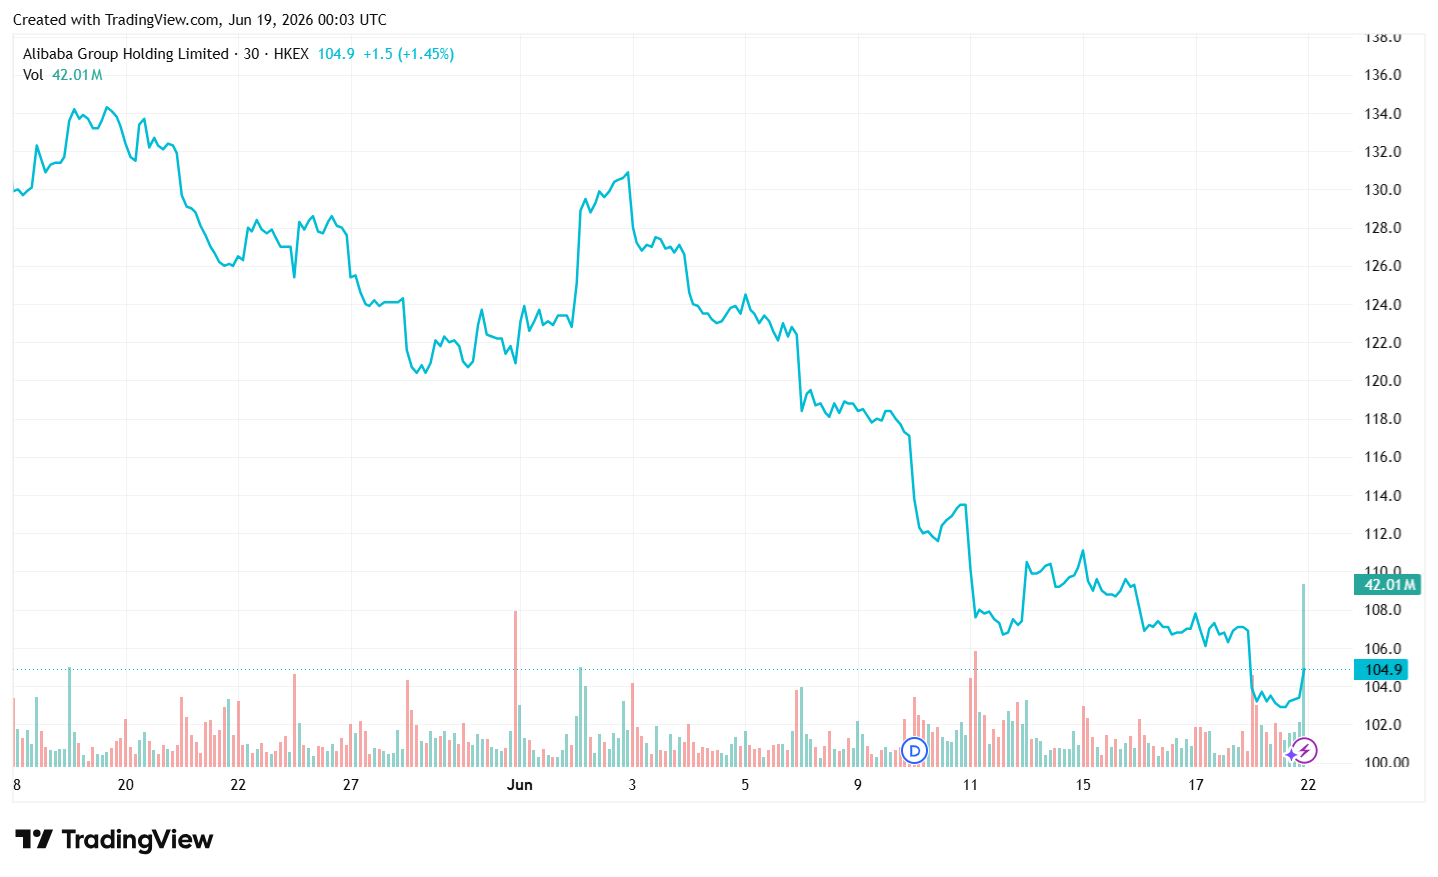
About Alibaba Group Holding Ltd Alibaba Group Holding Limited, through its subsidiaries, provides technology infrastructure and marketing reach to help merchants, brands, retailers, and other businesses in the People's Republic of China and internationally. It operates through the Alibaba China E-Commerce Group, Alibaba International Digital Commerce Group, Cloud Intelligence Group, and All Others segments. The Alibaba China E-commerce Group segment operates Taobao and Tmall, which are digital retail platforms; Taobao Instant Commerce, a local services and on-demand delivery platform; 1688.com, a domestic wholesale marketplace; and Xianyu, a consumer-to-consumer community and marketplace for idle goods. Its Alibaba International Digital Commerce Group segment includes AliExpress, a global e-commerce platform; Trendyol, an e-commerce platform in Turkey; Lazada, an e-commerce platform in Southeast Asia; Daraz, an e-commerce platform in South Asia, primarily in Pakistan and Bangladesh; and Alibaba.com, an integrated international online wholesale marketplace. The Cloud Intelligence Group segment offers a suite of cloud services based on infrastructure-as-a-service, platform-as-a-service, and model-as-a-service. Its All Others segment comprises Amap, a provider of mobile digital maps, navigation, and real-time traffic information in China; Cainiao, which provides logistics solutions; Youku, an online long-form video platform in China; Freshippo, a retail platform for groceries and fresh goods; and Alibaba Health, a pharmaceutical and healthcare services platform. Alibaba Group Holding Limited was incorporated in 1999 and is based in Hangzhou, China. Source: EODHD Key Stats
About Technology One Ltd Technology One Limited engages in the development, marketing, sale, implementation, and support of integrated enterprise business software solutions in Australia and internationally. It operates through Software and Consulting segments. The company offers various business software solutions, including business analytics, app builder, corporate performance management, curriculum, DxP local government, DxP Student, DxP Essentials, enterprise asset management, enterprise budgeting, enterprise cash receipting, enterprise content management, financials, human resources and payroll, performance planning, property and rating, spatial, student management, timetabling and scheduling, and supply chain management. It serves local government, education, government, health and community services, asset and project intensive, and financial services and corporate organizations. Technology One Limited was incorporated in 1983 and is headquartered in Fortitude Valley, Australia. Source: EODHD Key Stats