
The Earnings Revision Cycle: Why Stocks Move Before Results

Stocks frequently begin trending months before earnings are released. By the time results are announced, much of the move has already occurred. Markets do not price what has already happened; they price what they expect to happen next. Behind this forward-looking behaviour is an invisible engine driving the market: the earnings revision cycle, which adjusts expectations and sentiment well before numbers are public.
Understanding this cycle allows investors to interpret price action more effectively, anticipate volatility, and evaluate shifts in market sentiment before they are reflected in headline earnings.
What Is the Earnings Revision Cycle?
Publicly listed companies are covered by analysts whose role is to model revenue, margins, and earnings per share for future quarters and financial years. These forecasts are updated continuously as new information emerges, including management guidance, sector developments, competitor activity, macroeconomic shifts, and commodity price movements.
The earnings revision cycle refers to the pattern in which these estimates change over time and, importantly, how those changes tend to cluster. Revisions rarely occur in isolation. When one analyst lowers forecasts due to cost pressures or weakening demand, others frequently reassess their assumptions. Conversely, when operating conditions improve, upgrades often compound.
This clustering effect generates momentum in expectations. For instance, during periods of strong commodity demand, multiple mining companies may see upgrades in rapid succession, reinforcing market sentiment across a sector. As consensus earnings move higher or lower, valuation models adjust and capital responds accordingly. The market is therefore reacting not just to fundamentals, but to the trajectory of expectations about those fundamentals.
Markets Price Expectations, Not Headlines
A company’s share price reflects the present value of expected future cash flows. Expectations evolve continuously as management provides guidance, industry data shifts, macro conditions change, or competitors report new information. Analysts incorporate these inputs into their models, adjusting forward earnings estimates accordingly.
These estimate changes, whether upgrades or downgrades, often have a greater impact on share prices than reported earnings. When consensus earnings for the next 12 months rise materially, valuation frameworks adjust immediately. Declining estimates compress valuations well before an official downgrade. It is the direction of earnings expectations, rather than the absolute level, that typically drives price movement.
Forward-looking multiples such as forward P/E or PEG ratios also adjust in real time with revisions, providing early insight into valuation shifts relative to earnings expectations. Research houses consolidate individual forecasts into a consensus estimate that becomes a benchmark for institutional investors. Because revisions occur continuously, markets often price in anticipated outcomes well before results are formally released. Price movements that appear disconnected from news flow are often the visible expression of shifting expectations beneath the surface.
Why Stocks Move Before Earnings Are Reported
Institutional Positioning
Markets are forward-looking. Shifting expectations become embedded in prices through institutional positioning and the steady flow of information between reporting seasons. Large asset managers do not wait for earnings day to adjust exposure. When analysts revise forward estimates, portfolio managers reposition to manage risk and capture potential upside. Many quantitative strategies explicitly track earnings momentum, defined as the rate of change in forward estimates, meaning capital can begin moving as soon as revision trends turn.
Information Flow
Earnings outcomes rarely arrive without warning. Between formal reporting dates, markets digest a constant stream of signals including trading updates, management commentary, macro data, commodity prices, and competitor results. Analysts incorporate these inputs incrementally, adjusting revenue, margin, and earnings assumptions well before the company confirms the outcome. By the time earnings are announced, consensus expectations have often been recalibrated multiple times.
Expectation Embedding
Once a revised outlook becomes consensus, it is incorporated into valuation frameworks. Forward earnings that rise materially increase theoretical value, while falling estimates compress valuations. This explains why a company can beat earnings and still decline, or miss and still rally. Price reactions reflect how reported results compare with expectations already priced in, rather than the headline numbers themselves. In most cases, the earnings report confirms trends the market has anticipated for weeks or months.
Momentum and Feedback Loops in Earnings Revisions
Earnings revisions rarely occur in isolation. They tend to cluster, creating momentum that can amplify price movements. When one analyst lowers forecasts due to rising costs or weaker demand, others often reassess their assumptions. If the underlying conditions persist, multiple downgrades follow in quick succession. Conversely, improving trends or positive guidance often trigger initial upgrades, which subsequent analyst revisions compound.
This clustering produces a feedback loop that drives sustained earnings momentum. Early revisions signal a shift in fundamentals, prompting price reactions. Price action reinforces sentiment, leading additional analysts to adjust forecasts, while capital flows accelerate in the same direction. Over time, this can generate multi-month or even multi-year trends in share prices.
Valuation multiples also respond to these dynamics. During upgrade cycles, both earnings expectations and multiples often expand, while in downgrade cycles, estimates and multiples typically compress. Investors are not only recalibrating earnings forecasts but also adjusting confidence in those expectations, which explains why revision trends can persist longer than anticipated.
Turning Points and Inflection Signals
While earnings momentum can last for months, no cycle is permanent. Recognising inflection points is critical for investors seeking to manage risk and optimise positioning.
In downgrade cycles, early signs that the trend may be stabilising include a slowing pace of estimate cuts, stabilisation of revenue forecasts, margins holding above revised expectations, and management commentary shifting from defensive to neutral. Price action frequently stabilises before revisions fully turn positive, as markets anticipate that the worst of the downgrades has been priced in.
During strong upgrade cycles, warning signs that expectations may be peaking include incremental rather than material upgrades, valuations stretching above historical ranges, forward growth expectations embedded in multiples, and increased sensitivity to minor disappointments. Stocks often top when marginal upgrades become harder to achieve and the market’s confidence is fully reflected in price.
Inflection points are rarely marked by dramatic announcements. They emerge subtly through slowing revision momentum, plateauing forecasts, and a narrative shift from accelerating growth to sustainability. For disciplined investors, monitoring the rate of change in earnings estimates often provides more insight than focusing solely on headline numbers.
Why Investors Misread Earnings Reactions
Many investors respond instinctively to results. A strong quarter appears to justify buying; a miss appears to justify selling. Yet by the time results are released, markets have often already incorporated the implications.
This dynamic underpins the familiar pattern of buying the rumour and selling the news. When revisions trend higher ahead of results, capital often flows into the stock. Once the earnings announcement confirms what was widely expected, the catalyst is exhausted and early buyers may take profits.
Behavioural biases exacerbate the issue. Investors tend to anchor to the most recently reported earnings rather than the trajectory of forward estimates. They focus on whether the quarter appears strong or weak, rather than on how expectations have evolved.
Valuation can also mislead without context. A declining price to earnings ratio may reflect falling earnings expectations rather than genuine value. Conversely, investors may sell during early recovery phases because reported profits remain weak, even though forward estimates have stabilised or begun to rise. In many cases, the strongest share price gains occur when revisions move from negative to neutral or modestly positive.
Understanding where a company sits within its revision cycle is often more informative than judging the latest result in isolation.
Practical Takeaways for Investors
Incorporating the earnings revision cycle into an investment process does not require complex modelling. It requires disciplined observation of how expectations are evolving.
Track Revision Trends, Not Just Consensus: Review how estimates have changed over the past three to six months. Rising forecasts indicate improving fundamentals and positive momentum. Persistent downward revisions suggest ongoing pressure.
Integrate Revisions into Positioning and Risk Management: Holding a stock into earnings when estimates are improving from a low base carries different risk than holding a stock that has already been re-rated on elevated expectations. Understanding the revision context can inform position sizing and timing.
Monitor Sector-Wide Patterns: Revisions often cluster at the industry level. Broad-based upgrades or downgrades may signal structural shifts in demand, pricing, or cost dynamics.
Recognise When to Follow or Fade Momentum: Stocks that have already moved aggressively on sustained upgrades and are priced for perfection carry heightened post-earnings risk. Conversely, waiting for stabilisation during downgrade cycles can improve entry points.
Maintain a Holistic Framework:
Earnings revisions should be considered alongside valuation, balance sheet strength, macro conditions, and competitive positioning. The rate of change in expectations is a powerful signal but must be assessed in context.
Conclusion
The earnings revision cycle is a subtle but powerful force in financial markets. It explains why stocks often move ahead of official results and highlights the importance of monitoring analyst activity and market sentiment. Understanding this cycle provides a framework for interpreting volatility, anticipating potential outcomes, and making informed, forward-looking investment decisions.
While earnings revisions are not foolproof predictors of results, they offer valuable signals when combined with operational insights, macro trends, and historical patterns. Recognising the drivers, measuring momentum, and applying disciplined analysis allows investors to navigate pre-earnings market movements with clarity and confidence.
In a market increasingly driven by expectations rather than hindsight, appreciating the mechanics of the earnings revision cycle is essential for any investor seeking to understand why stocks move before numbers are officially announced.
Subscribe to our newsletter
Disclaimer: This article does not constitute financial advice nor a recommendation to invest in the securities listed. The information presented is intended to be of a factual nature only. Past performance is not a reliable indicator of future performance. As always, do your own research and consider seeking financial, legal and taxation advice before investing.
Speak to an Advisor

The RBA has raised rates to 4.60% as inflation pressures persist. Explore the impact of energy costs, AI demand and the key signals investors should watch next.

Discover how advances in genomics, AI, diagnostics and gene editing are creating a broader healthcare opportunity and where commercial value is emerging.

The AI trade is being forced to rethink the pace of progress. Here is what investors should watch across Nvidia, chips, AI spending, software and adoption.

Copper is at a record high, yet the global market still has a surplus. So where is all the copper, and why is it becoming harder to find?

Sharewise CEO Alex Perry sat down with ausbiz to unpack how the platform approached FY26, a year in which it reported an ASX return of almost 11% and a US return above 32%. The conversation ranged from the AI infrastructure theme to specific names on Perry's radar in resources and quantum computing. Here's a rundown of the key points.

Warsh gave markets a framework, not a forecast. What his first Jackson Hole keynote means for inflation, rates, forward guidance and the outlook for equities.
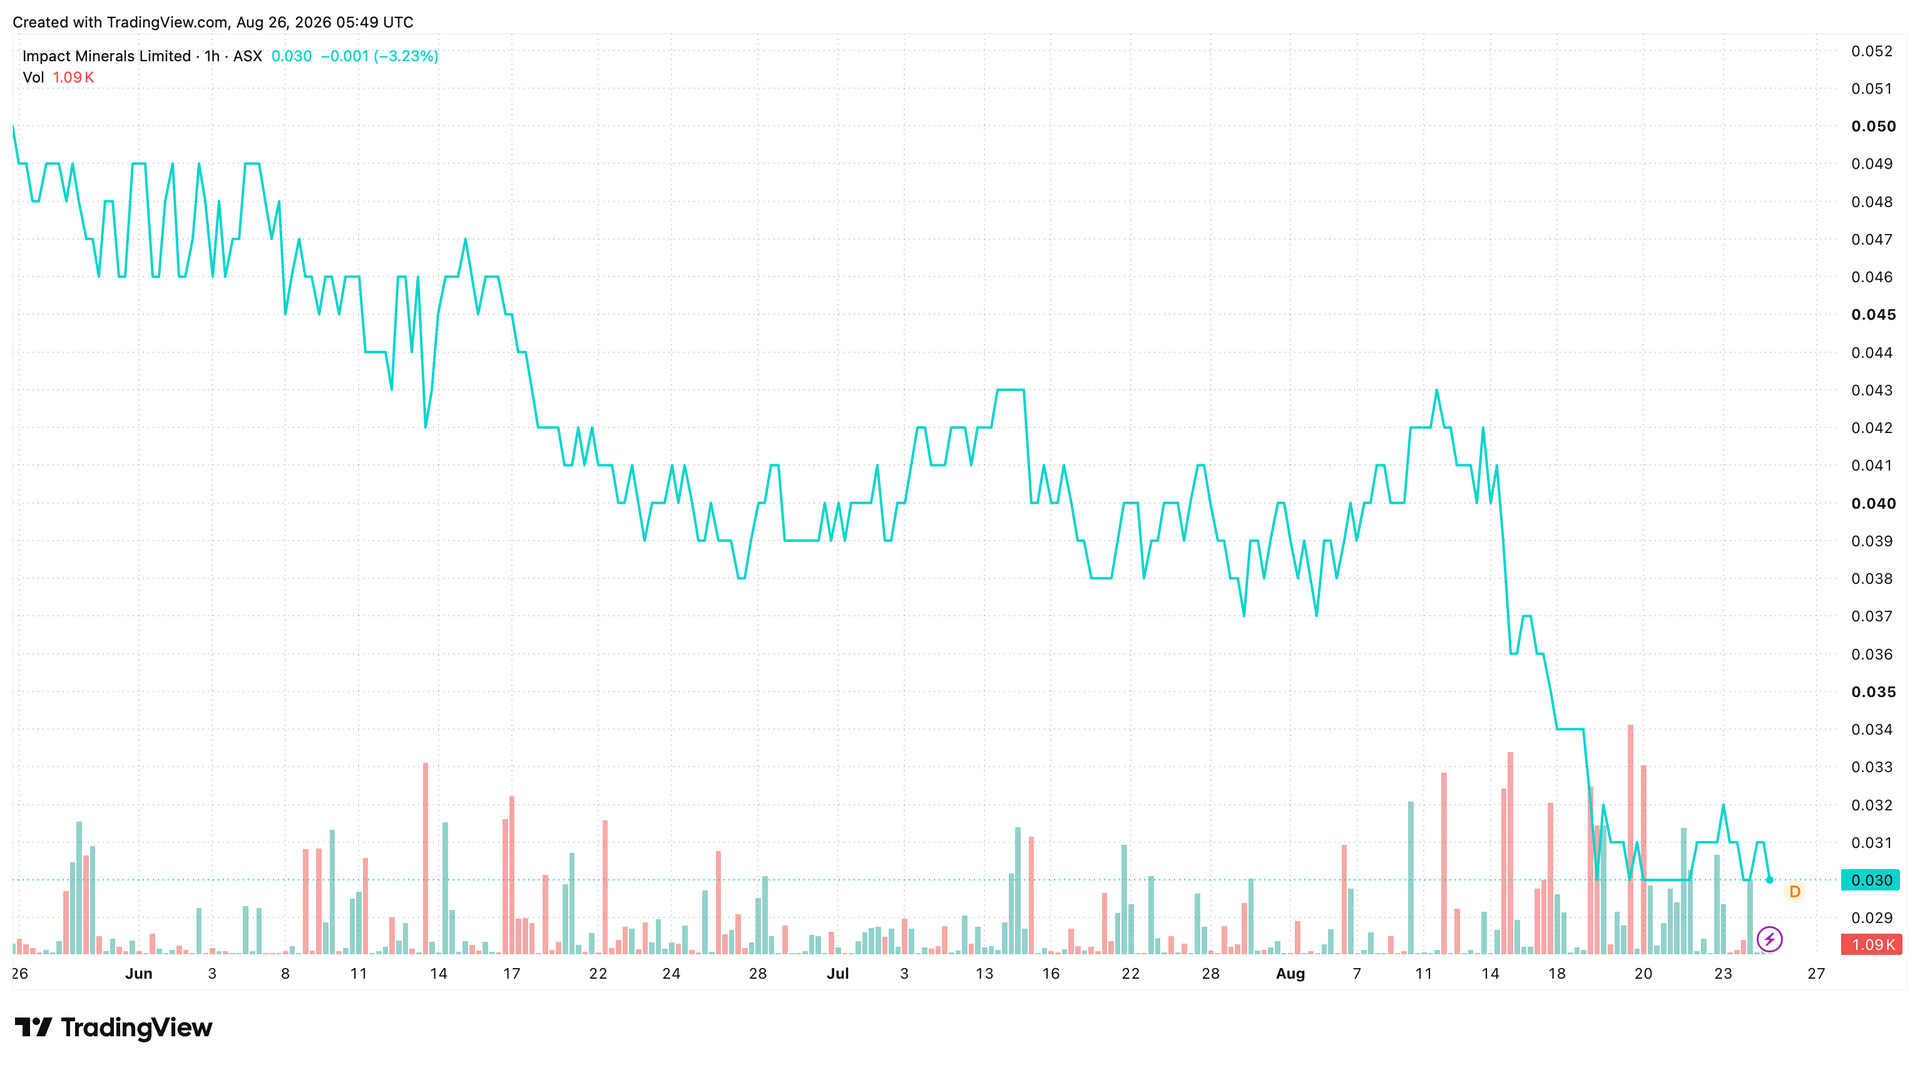
Get the latest on Impact Minerals (ASX: IPT), including stock performance, technical analysis, forecasts & key insights. See if IPO supports your goals.
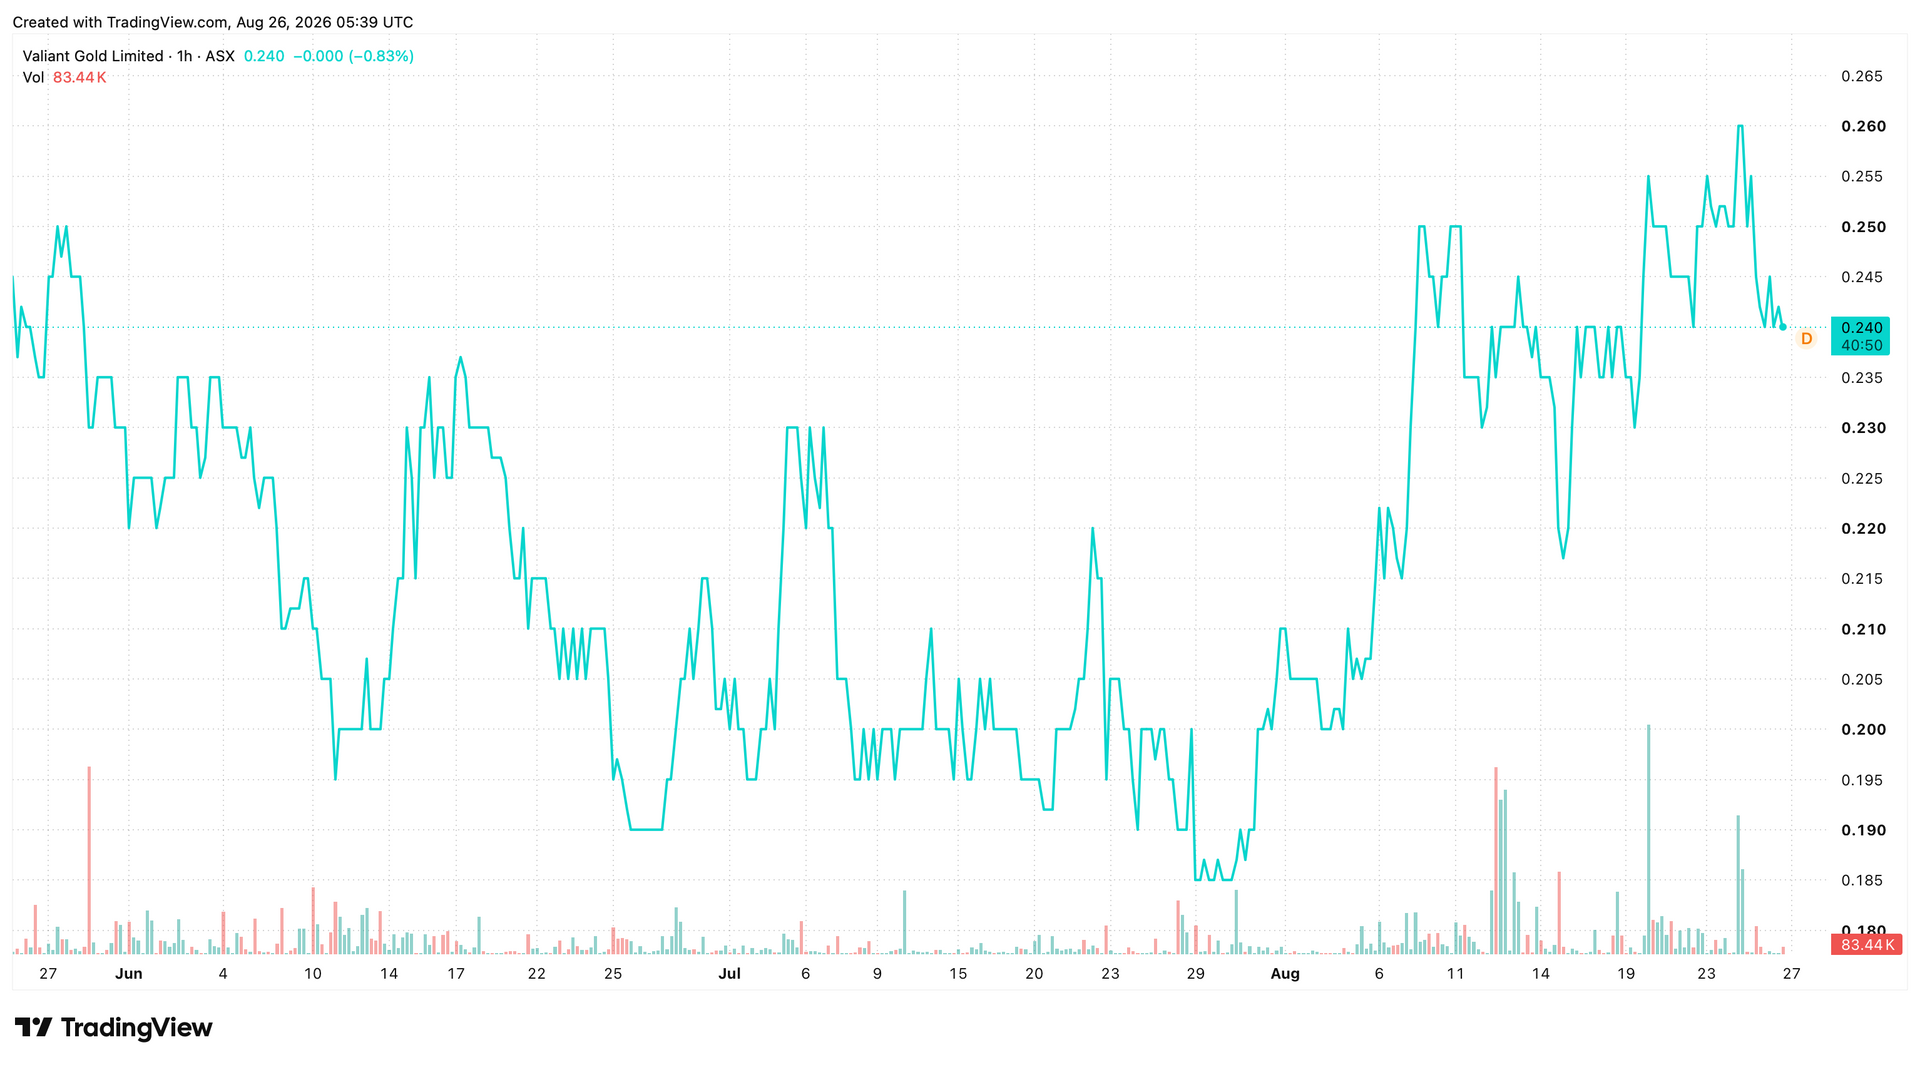
Get the latest on Valiant Gold (ASX: VAL) with our share price, technical analysis, forecasts & key insights. See if this ASX gold stock fits your investment goals.
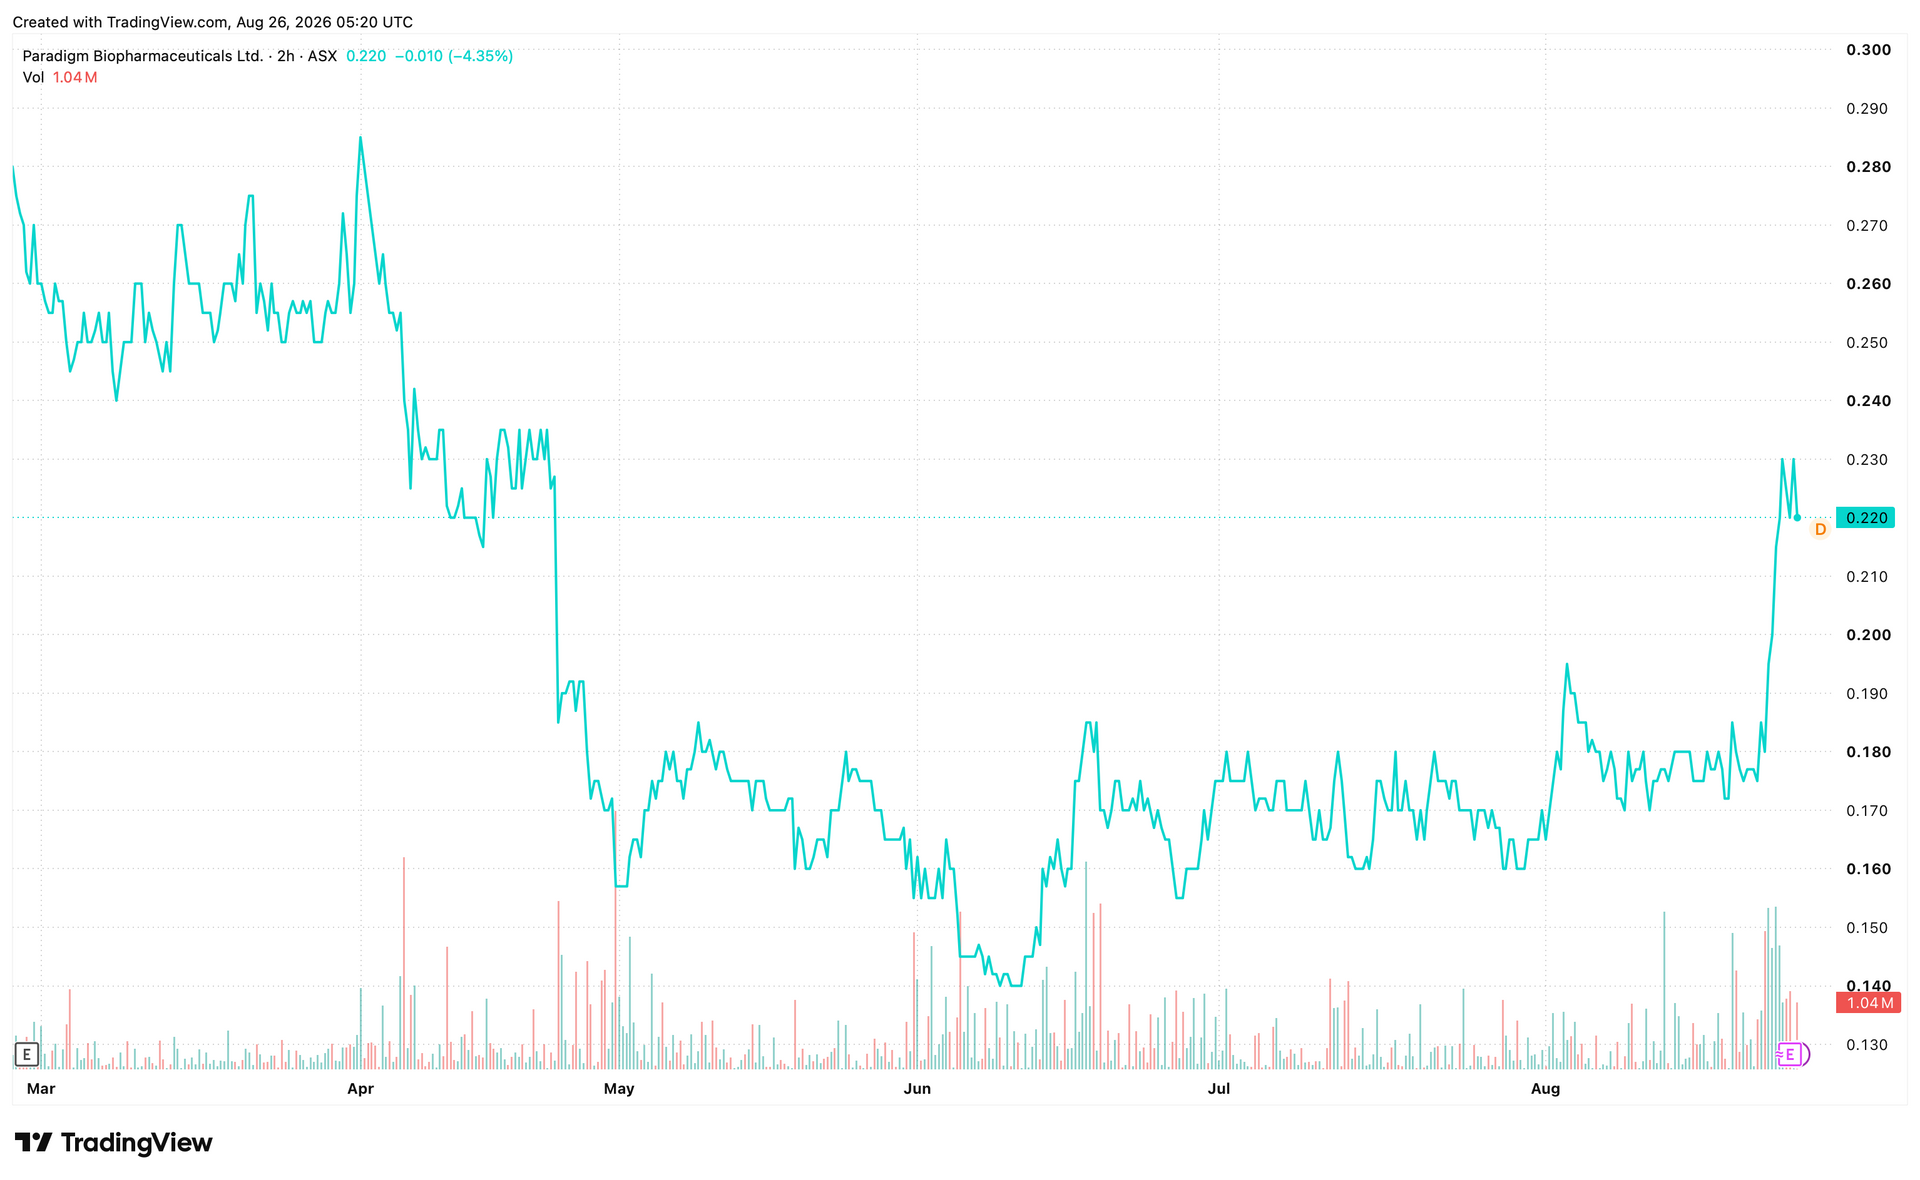
Learn about Percheron Therapeutics (ASX: PER). Offering share price, technical analysis, forecasts & insights. See if this ASX biotech stock fits your goals.

Brent crude hits US$91 as US-Iran talks stall and Strait of Hormuz disruption persists. What's driving the move and what comes next for oil
