CPI Explained: Why One Number Drives Markets, Rates and Portfolios

Every month, a single data release stops trading desks, moves bond yields, reprices currencies and reshapes expectations for interest rates across developed markets. That release is the Consumer Price Index.
CPI is, at its core, a statistical estimate of how much consumer prices have changed over time. Its market impact extends far beyond that definition. It sits at the beginning of the most important chain in modern finance. Inflation data shapes inflation expectations, inflation expectations influence central bank policy, and central bank policy determines the cost of capital across every asset class.
Markets do not react to CPI itself. They respond to what CPI implies for interest rates, real yields and liquidity conditions. A modest deviation from expectations can trigger a repricing across equities, bonds and currencies within seconds. Understanding that transmission is essential to interpreting market behaviour in the current environment.
What CPI Actually Measures and What It Does Not
The Consumer Price Index measures the change in prices paid by households for a representative basket of goods and services over time. In Australia, the basket is compiled by the Australian Bureau of Statistics and includes categories such as housing, food, transport, health and education, each weighted according to household expenditure.
The headline figure reflects the annual change in this basket and is the most widely cited measure of inflation. Core measures, including the trimmed mean, exclude the most volatile components to provide a clearer view of underlying price pressures and are more closely aligned with the Reserve Bank’s policy framework.
Despite its importance, CPI has limitations. It is inherently backward looking, capturing price changes that have already occurred. By the time a print is released, underlying conditions may have shifted. Markets, by contrast, are forward looking, and the gap between the two is a key source of volatility around release days.
The index also does not fully capture behavioural changes. Households adjust consumption in response to price movements, substituting toward cheaper alternatives, while CPI assumes a fixed basket. This can overstate the effective cost of living over time.
Volatile components can further distort the signal. Energy and housing costs can move sharply due to policy changes or external shocks rather than underlying demand. A large move in one component can lift the headline figure without indicating a broad-based shift in inflation. CPI should therefore be treated as an approximation that requires interpretation rather than a precise measure.
Why Markets Care: From Inflation to Interest Rates
The influence of CPI on markets operates through central bank policy. Most developed economies target inflation within a defined range. In Australia, the Reserve Bank aims to keep inflation between 2% and 3% over time.
When CPI exceeds that range, central banks are expected to tighten policy by raising interest rates or maintaining restrictive settings. When inflation moderates, the path toward easing becomes more credible.
Markets anticipate these responses. A CPI print above expectations leads investors to price in higher rates or delays to expected cuts. A softer print shifts expectations in the opposite direction.
The key variable is not the level of inflation but the deviation from expectations. Markets are positioned ahead of the release. If the data aligns with forecasts, the reaction is limited. If it surprises, repricing is immediate.
This dynamic has been particularly pronounced in the current cycle. The Reserve Bank of Australia cut rates three times in 2025 on the expectation that inflation was returning to target, only to reverse course when inflation proved more persistent than forecast. Each CPI release effectively reset the expected path for rates, reinforcing the sensitivity of markets to inflation data well into 2026. The concept of higher for longer, where rates remain restrictive for an extended period rather than returning quickly to neutral, emerged directly from repeated upside surprises in CPI.
The Mechanism: How CPI Moves Asset Prices
CPI does not move asset prices directly. Its influence operates through three core channels, each affecting portfolios with varying intensity and timing.
Interest Rates and Real Yields
The most immediate channel is through nominal interest rates and their inflation-adjusted equivalent, real yields. When CPI exceeds expectations, markets anticipate a more restrictive policy response, pushing nominal yields higher. If this increase outpaces the inflation component embedded in the data, real yields rise. Higher real yields increase the discount rate applied to future earnings and cash flows, reducing the present value of assets whose valuations depend on long-duration income streams. This explains the sensitivity of growth equities and the sharp repricing of long-duration bonds when inflation data surprises.
Currency Markets
The second channel operates through exchange rates. Stronger inflation typically leads to expectations of higher interest rates, attracting capital inflows and supporting the domestic currency. Softer inflation reduces rate expectations and places downward pressure on the currency. For Australian investors, this effect is material. A stronger AUD reduces the translated return on USD-denominated assets, while a weaker AUD amplifies those returns. Currency movements are therefore a consistent source of portfolio variation linked to inflation data.
Liquidity
The third channel is broader but equally important. Elevated inflation compels central banks to tighten financial conditions through higher rates and reduced balance sheet support, increasing the cost of capital and dampening risk appetite. When inflation moderates, policy can shift toward easing, improving liquidity conditions and supporting asset prices. CPI should therefore be understood as a signal for financial conditions, shaping the liquidity environment that drives asset valuations.
These channels operate simultaneously. CPI does not move markets directly. It alters the variables that determine how markets are priced.
Asset Class Implications: Who Wins and Who Loses
The impact of CPI varies across asset classes depending on sensitivity to rates, inflation and liquidity.
Equities
are affected through both valuation and earnings. Higher inflation and rising rates compress valuation multiples, particularly for growth stocks. At the same time, higher input costs can pressure margins where pricing power is limited. Financials may benefit from higher rates, while defensive sectors tend to be more resilient.
Fixed income is directly exposed. Bond prices move inversely to yields, making them sensitive to inflation-driven rate expectations. Duration becomes the key risk variable, with longer-duration assets more exposed to repricing.
Commodities and gold respond differently. Commodities often benefit from inflation through rising prices. Gold is more sensitive to real yields. Rising real yields create a headwind, while falling real yields support demand.
Real assets such as property and infrastructure reflect a balance between inflation-linked income and higher financing costs. Inflation can support cash flows, but higher rates compress valuations. CPI therefore reshapes relative performance rather than driving a single market direction.
CPI in Practice: Why One Print Can Move Markets Sharply
The transmission mechanism plays out most clearly on CPI release days, where market moves are often sharp and disproportionate to the size of the surprise.
The primary driver is positioning. In the lead-up to a release, investors position based on forecasts. When the actual print deviates from expectations, those positions must adjust. If positioning is crowded, the adjustment is amplified, leading to outsized moves relative to the data.
This effect can become self-reinforcing. Systematic strategies and algorithmic models respond to initial price moves, extending the repricing before stabilisation. Volatility on CPI days therefore reflects both the information in the data and the structure of market positioning.
Markets also interpret each print within a broader trend. A single release is treated as an update to the trajectory of inflation. Direction matters more than level. A print that confirms a slowing trend supports expectations for easing, while a reversal can shift the expected policy path in a single data point.
What Investors Should Focus On and Portfolio Implications
For investors, the objective is not to forecast CPI but to interpret its implications for policy and positioning.
The focus should be on composition rather than headline figures. Core measures such as the trimmed mean provide a clearer signal of persistent inflation, while services inflation reflects domestic demand and wage pressures.
Momentum is equally important. Whether inflation is rising or falling shapes the expected rate path. Markets price trajectories rather than static outcomes.
Avoid overreacting to individual prints. Central banks respond to accumulated data, not single releases. CPI should inform structural positioning across duration, sector exposure, currency and inflation hedges, rather than trigger short-term portfolio shifts.
From a portfolio perspective, CPI should inform structural positioning rather than short-term trading. Duration exposure in fixed income, sector allocation in equities and currency positioning should reflect the broader inflation regime.
In a higher inflation environment, shorter duration, pricing power and real asset exposure tend to be more resilient. In a disinflationary environment, duration and growth assets benefit from falling yields.
Diversification remains critical. Inflation outcomes are uncertain, and portfolios should be constructed to perform across a range of scenarios rather than a single forecast.
From Data Point to Market Narrative
CPI is a backward-looking measure of consumer price changes, yet it consistently drives significant moves across equities, bonds, currencies and commodities. This reflects its role as a forward-looking signal. Markets are not reacting to past price changes, but to what those changes imply for interest rates, real yields and financial conditions.
The number itself matters less than the narrative it shapes. Each CPI release updates expectations around the trajectory of inflation and the likely response of central banks. It is not a verdict on current conditions, but an input into whether policy is sufficiently restrictive or requires further adjustment to return inflation to target.
For investors, the value lies in interpretation. Understanding CPI through its components, momentum and policy implications provides a clearer framework for positioning across asset classes. The focus is not the number itself, but what it signals for the broader market environment.
Subscribe to our newsletter
Disclaimer: This article does not constitute financial advice nor a recommendation to invest in the securities listed. The information presented is intended to be of a factual nature only. Past performance is not a reliable indicator of future performance. As always, do your own research and consider seeking financial, legal and taxation advice before investing.

Big Tech earnings could shake your portfolio this week. Understand how the latest results may influence global markets, the ASX and your investment strategy.

A second strategic chokepoint is under threat after Hormuz. Discover how the Bab al-Mandeb blockade could affect oil prices, inflation, interest rates and your portfolio.
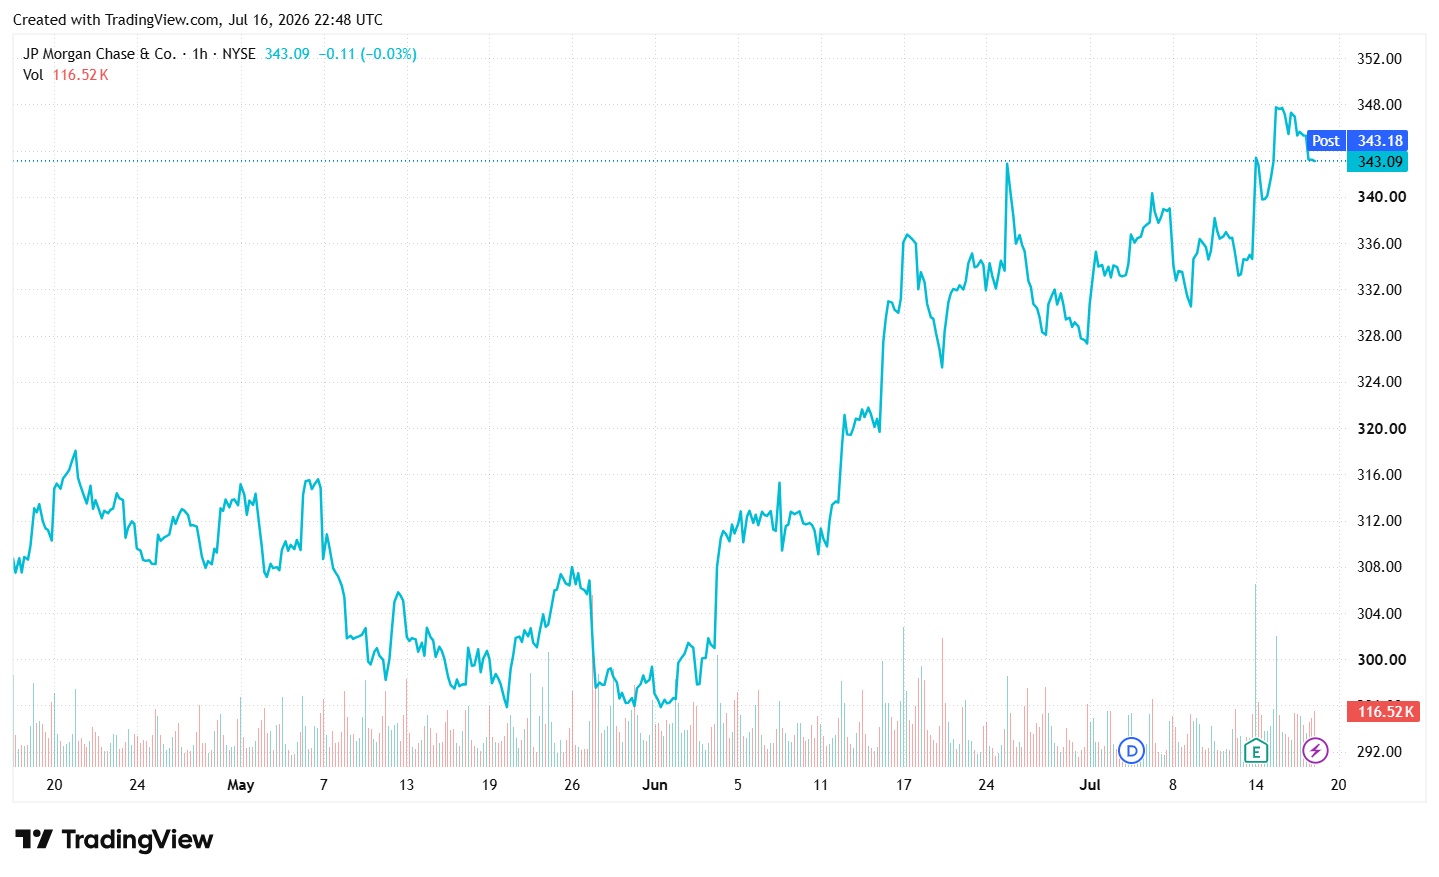
This week's Stock Spotlight is NYSE-listed JPMorgan Chase & Co. About JPMorgan Chase & Co. JPMorgan Chase & Co. operates as a bank and financial holding company in the United States, rest of North America, Europe, the Middle East, Africa, the Asia Pacific, Latin America, and the Caribbean. It operates in three segments: Consumer & Community Banking, Commercial & Investment Bank, and Asset & Wealth Management. The company offers deposit, investment and lending products, and cash management; mortgage origination and servicing activities; residential mortgages and home equity loans; and credit cards, payment solutions, travel services, merchant offers, lifestyle benefits, auto loans, and leases to consumers and small businesses through bank branches, ATMs, and digital and telephone banking. It also provides investment banking, market-making, financing, custody, and securities products and services; corporate strategy and structure advisory, equity and debt market capital-raising, and loan origination and syndication services; cash and derivative instruments, risk management solutions, prime brokerage, clearing, and research; and fund services, liquidity and trading services, and data solutions products for large corporations, financial institutions, merchants, start-ups, small and midsized companies, local governments, municipalities, nonprofits, and commercial real estate clients. In addition, the company offers multi-asset investment management solutions in equities, fixed income, alternatives, and money market funds to institutional clients and retail investors; retirement products and services, estate planning, lending, deposits, and investment management products to high-net-worth clients; and financial transaction processing. JPMorgan Chase & Co. was founded in 1799 and is headquartered in New York, New York. Source: EODHD Key Stats
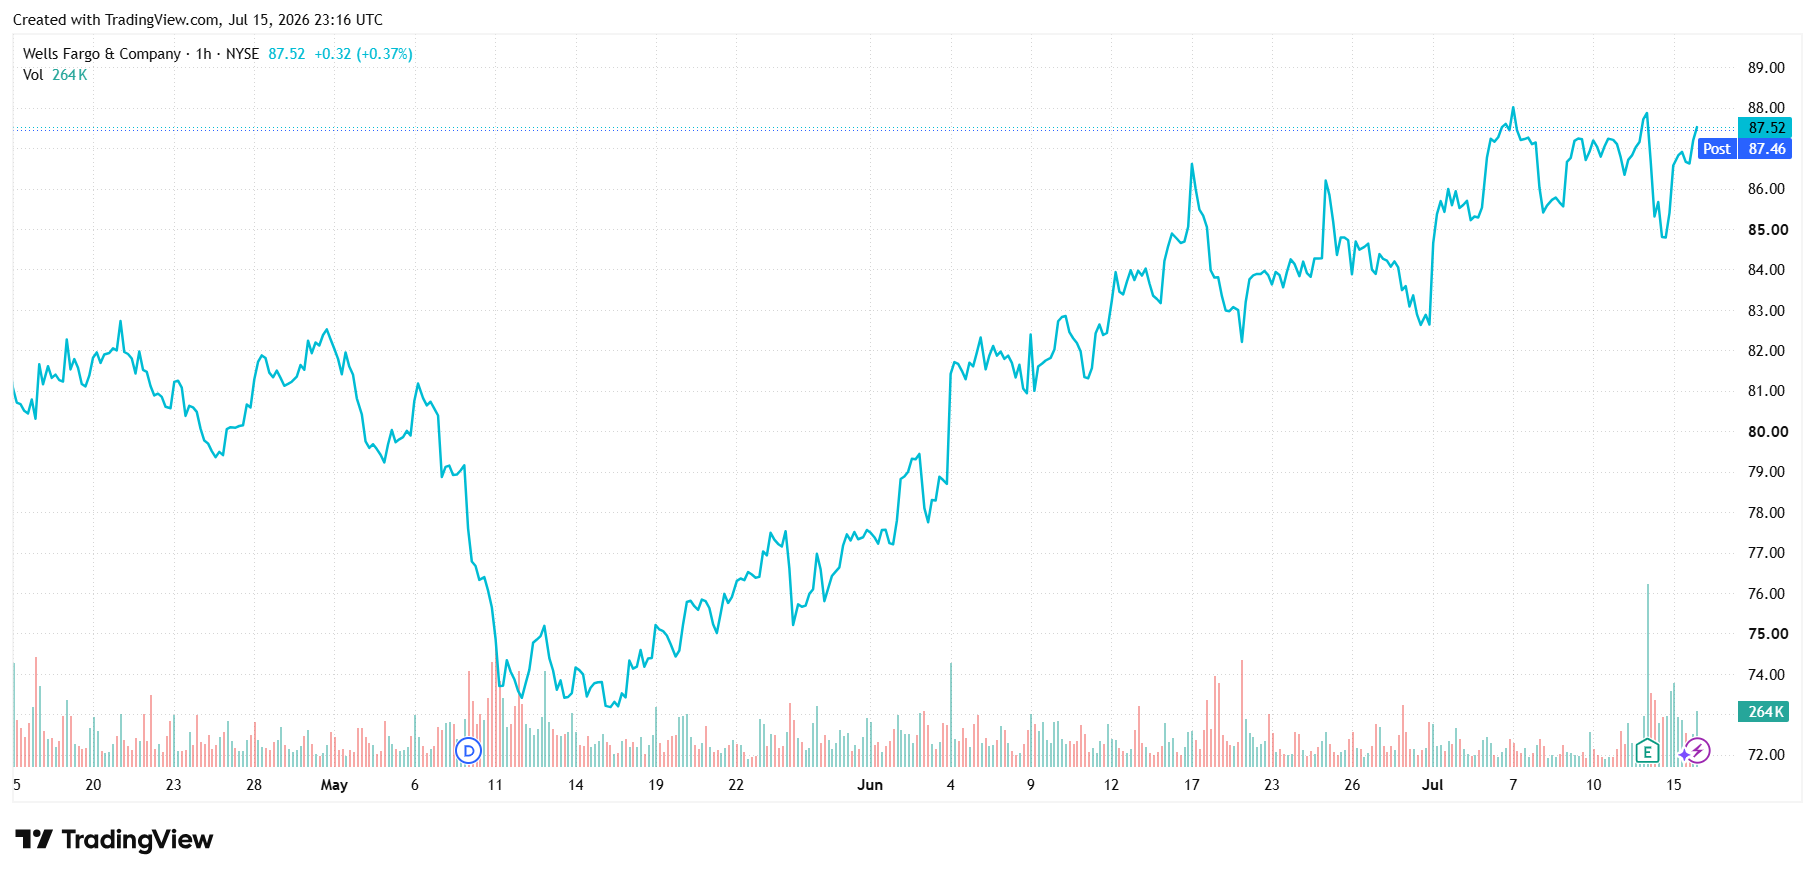
This week's Stock Spotlight is NYSE-listed Wells Fargo & Company. About Wells Fargo & Company. Wells Fargo & Company, a financial services company, provides diversified banking, investment, mortgage, and consumer and commercial finance products and services in the United States and internationally. It operates through four segments: Consumer Banking and Lending; Commercial Banking; Corporate and Investment Banking; and Wealth and Investment Management. The company's financial products and services includes checking and savings accounts, and credit and debit cards, as well as home, auto, personal, and small business lending services. It also provides personalized wealth management, brokerage, financial planning, lending, private banking, trust and fiduciary products and services; and financial solutions to private, family owned and public companies through products and services including banking and credit products across multiple industry sectors and municipalities, secured lending and lease products, and treasury management. In addition, it offers a suite of capital markets, banking, and financial products and services, such as corporate banking, investment banking, treasury management, commercial real estate lending and servicing, equity, and fixed income solutions, as well as sales, trading, and research capabilities services to corporate, commercial real estate, government, and institutional clients. Wells Fargo & Company was founded in 1852 and is headquartered in San Francisco, California. Source: EODHD Key Stats
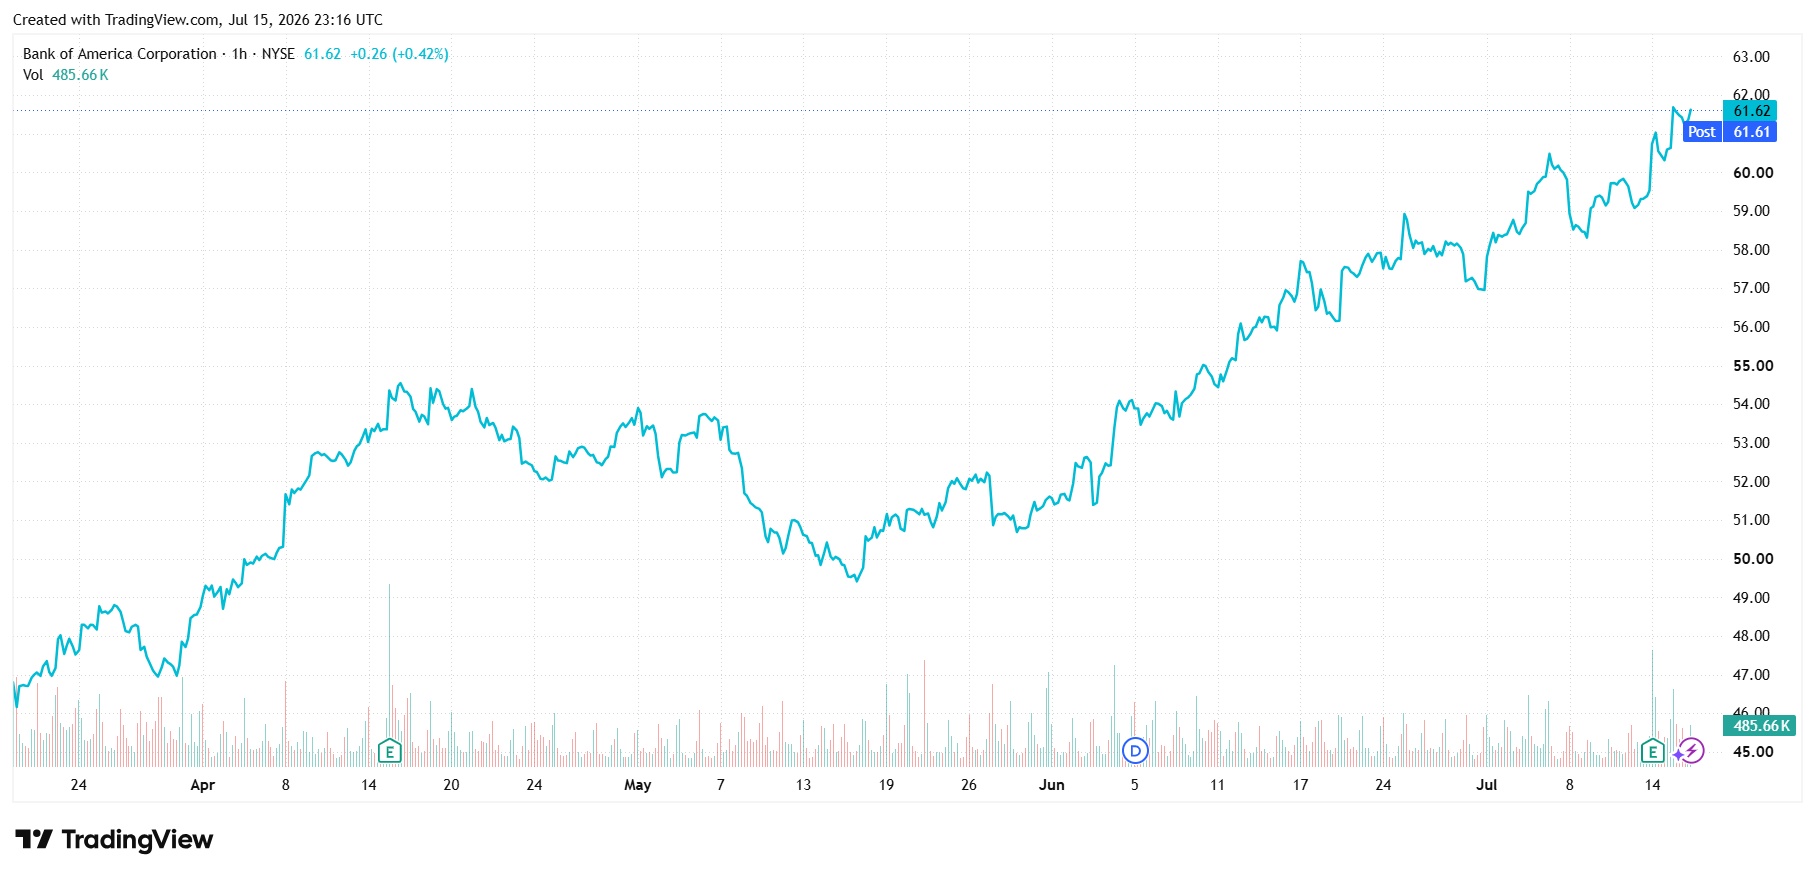
This week's Stock Spotlight is NYSE-listed Bank of America Corp. About Bank of America Corp. Bank of America Corporation, through its subsidiaries, provides various financial products and services for individual consumers, small and middle-market businesses, institutional investors, large corporations, and governments worldwide. It operates through four segments: Consumer Banking, Global Wealth & Investment Management (GWIM), Global Banking, and Global Markets. The Consumer Banking segment offers traditional and money market savings accounts, certificates of deposit and IRAs, checking accounts, and investment accounts and products; credit and debit cards; residential mortgages and home equity loans; and direct and indirect loans. The GWIM segment provides investment management, brokerage, banking, and trust and retirement products and services; wealth management solutions; and customized solutions, including specialty asset management services. The Global Banking segment offers lending products and services, including commercial loans, leases, commitment facilities, trade finance, and commercial real estate and asset-based lending; treasury solutions, and underwriting and advisory services. The Global Markets segment provides market-making, financing, securities clearing, settlement, and custody services; securities and derivative products; and risk management products using interest rate, equity, credit, currency and commodity derivatives, foreign exchange, fixed-income, and mortgage-related products. Bank of America Corporation was founded in 1784 and is based in Charlotte, North Carolina. Source: EODHD Key Stats
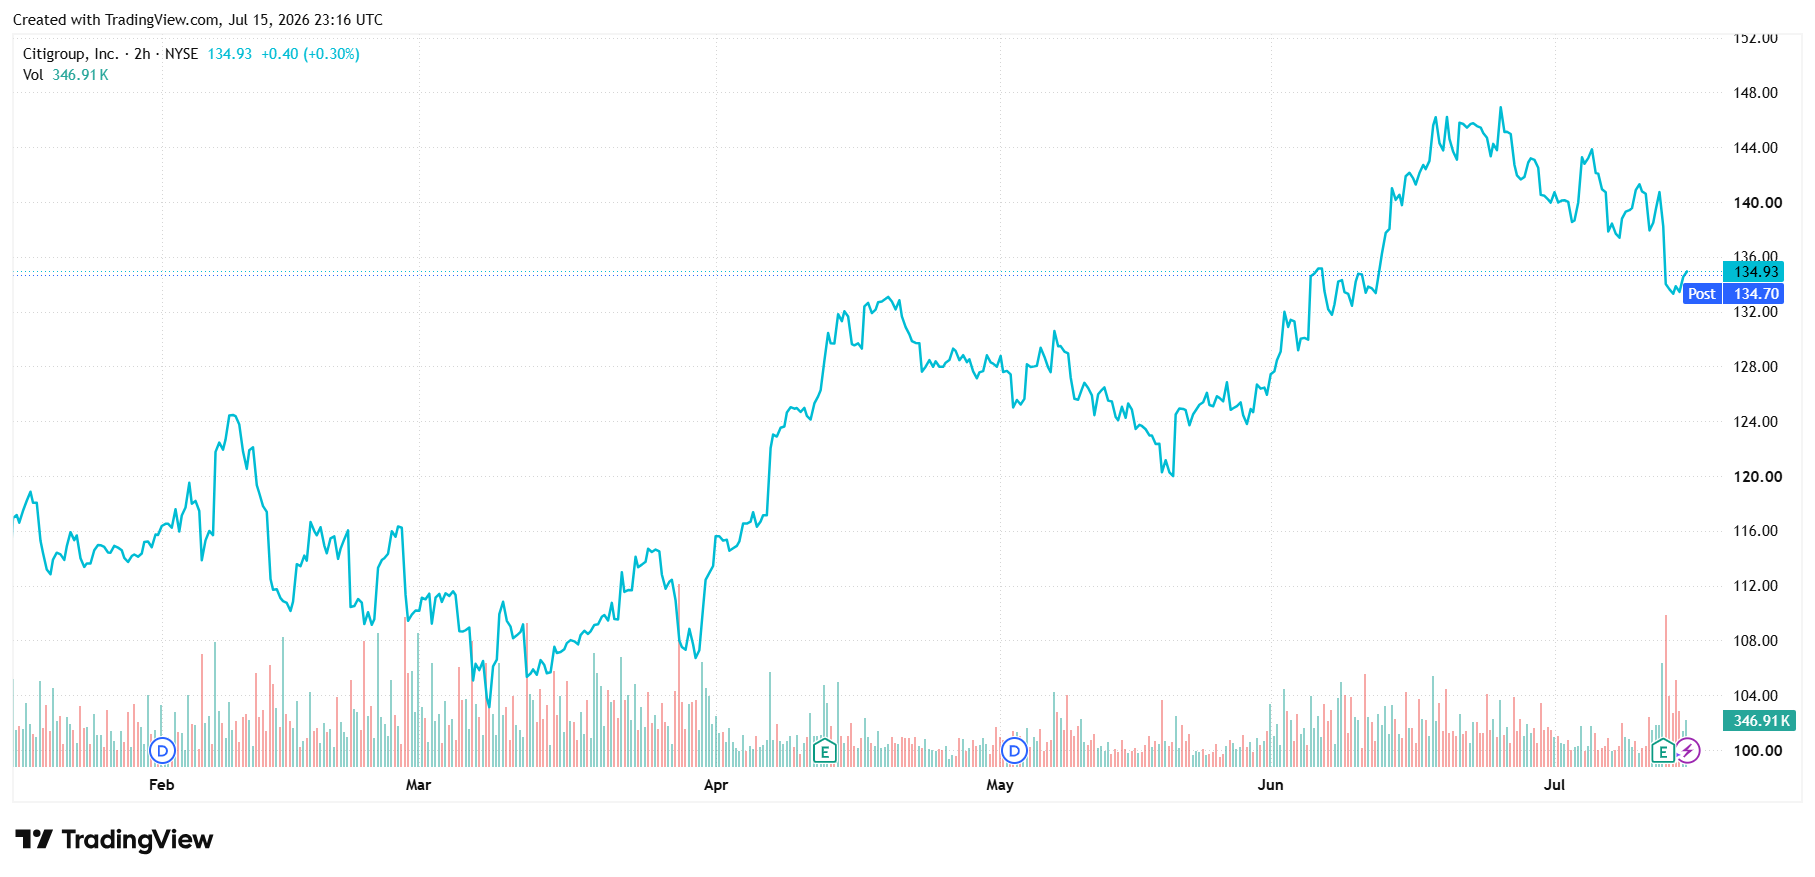
This week's Stock Spotlight is NYSE-listed Citigroup Inc. About Citigroup Inc. Citigroup Inc., a diversified financial service holding company, provides various financial products and services to consumers, corporations, governments, and institutions. It operates through five segments: Services, Markets, Banking, U.S. Personal Banking, and Wealth. The Services segment includes treasury and trade solutions, which provides cash management, trade, and working capital solutions to multinational corporations, financial institutions, and public sector organizations; and securities services, such as cross-border support for clients, local market expertise, post-trade technologies, data solutions, and various securities services solutions. The Markets segment offers sales and trading services for equities, foreign exchange, rates, spread products, and commodities to corporate, institutional, and public sector clients; and market-making services, including asset classes, risk management solutions, financing, and prime brokerage. The Banking segment includes investment banking services comprising equity and debt capital markets-related strategic financing solutions; advisory services related to mergers and acquisitions, divestitures, restructurings, and corporate defense activities; and corporate lending consists of corporate and commercial banking. The U.S. Personal Banking segment provides proprietary and co-branded card portfolios; and traditional banking services to retail and small business customers. The Wealth segment offers financial services to high-net-worth clients through banking, lending, mortgages, investment, custody, and trust product offerings; professional industries, including law firms, consulting groups, accounting, and asset management; and affluent and high net worth clients. The company operates in North America, the United Kingdom, Japan, North and South Asia, Australia, Europe, the Middle East, and Africa. Citigroup Inc. was founded in 1812 and is headquartered in New York, New York. Source: EODHD Key Stats

AI is driving unprecedented demand for data centres. Discover how the infrastructure powering AI is creating opportunities across energy, property and technology.
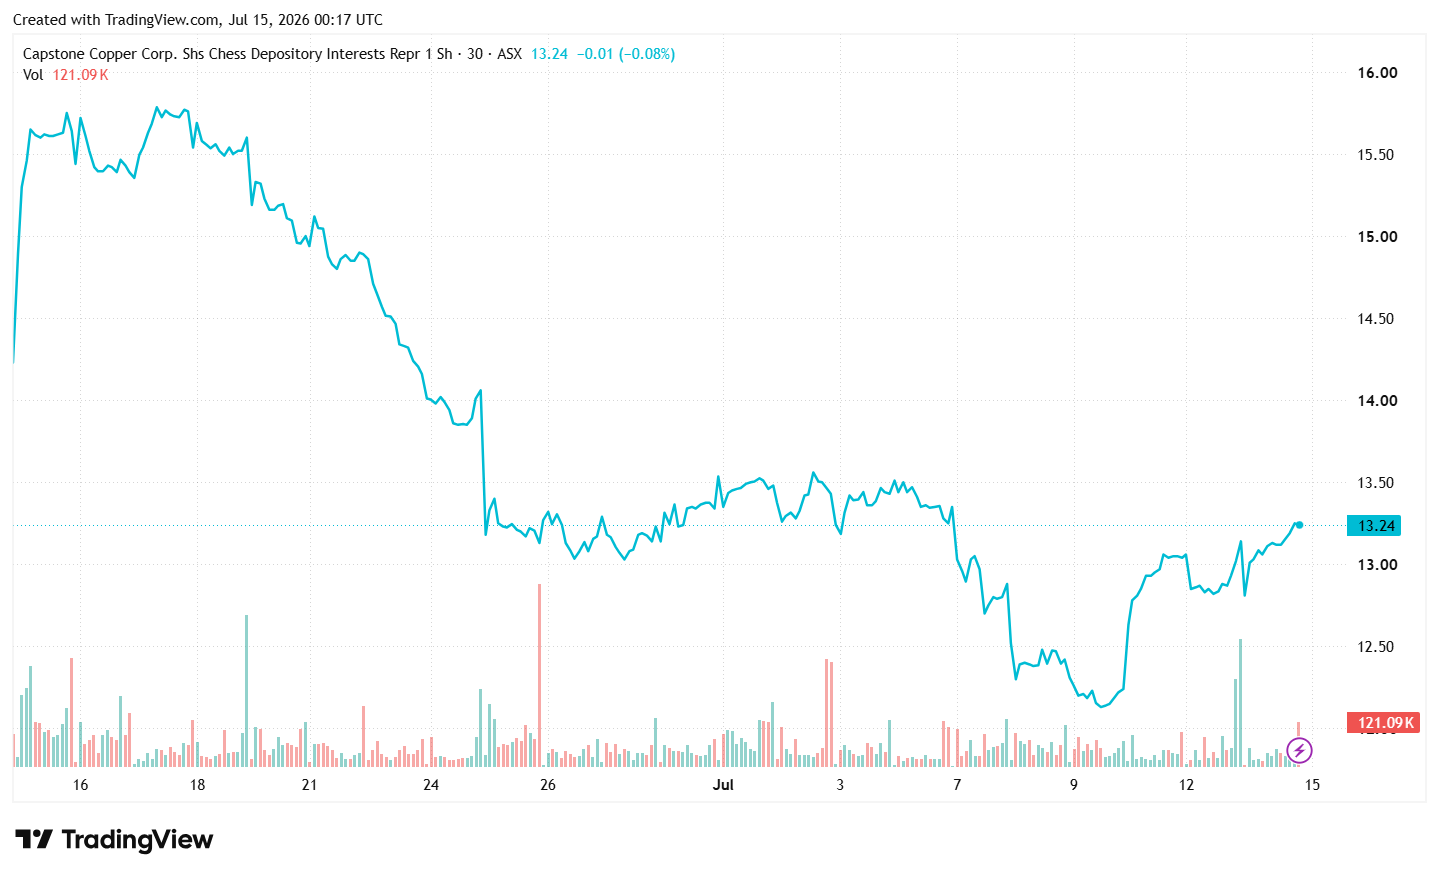
About Capstone Copper Corp. Capstone Copper Corp., a copper mining company, mines, explores for, and develops mineral properties in the United States, Chile, and Mexico. The company primarily explores copper, silver, gold, molybdenum, zinc, iron, cobalt, and other base metals. Capstone Copper Corp. is headquartered in Vancouver, Canada. Source: EODHD Key Stats
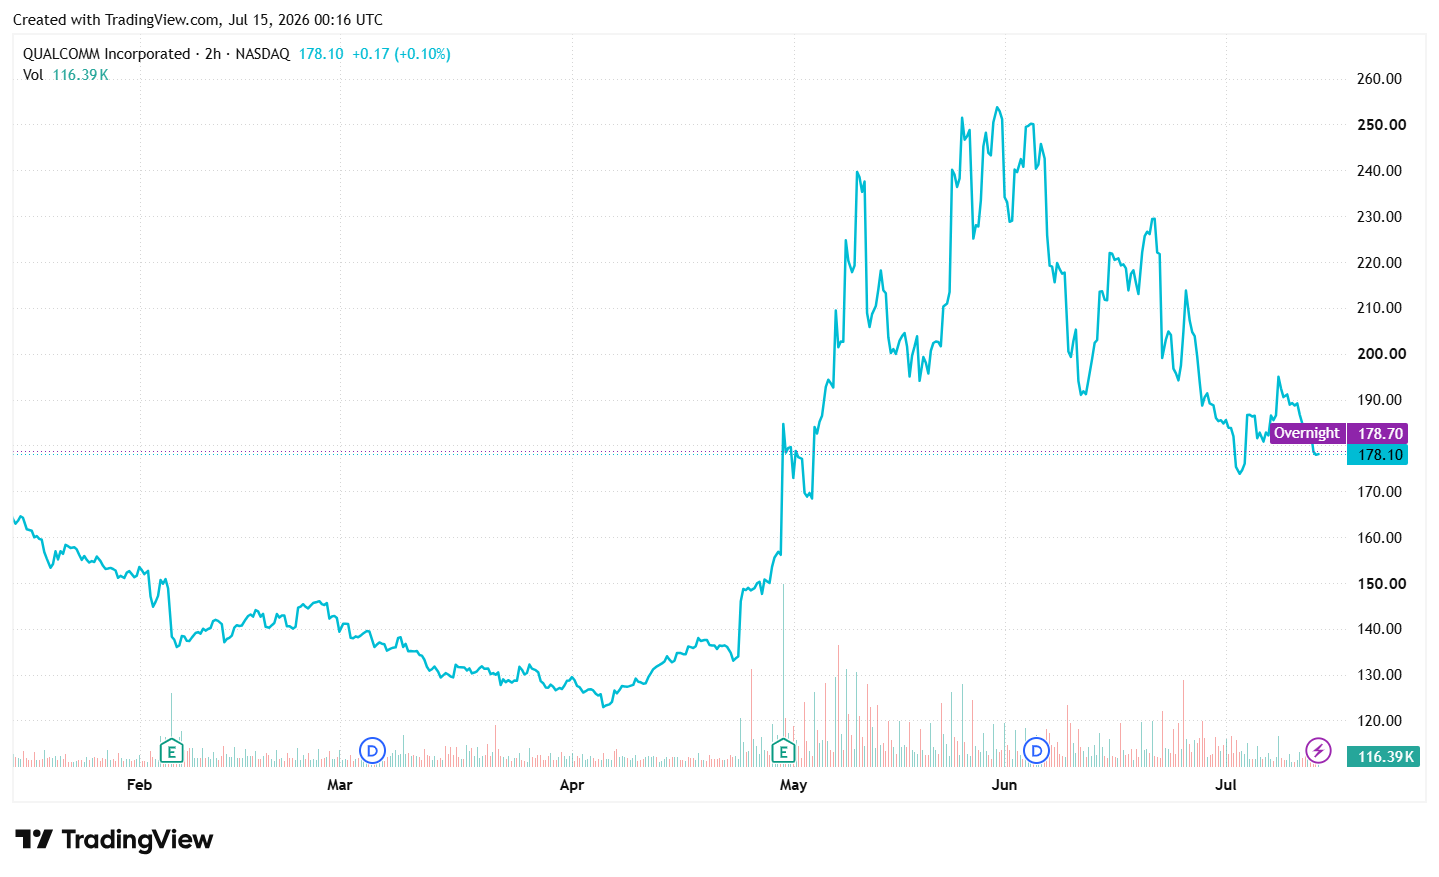
About Qualcomm Inc. QUALCOMM Incorporated engages in the development and commercialization of foundational technologies for the wireless industry worldwide. It operates through three segments: Qualcomm CDMA Technologies (QCT); Qualcomm Technology Licensing (QTL); and Qualcomm Strategic Initiatives (QSI). The QCT segment develops and supplies integrated circuits and system software with connectivity and computing technologies for use in mobile devices; automotive systems for connectivity, digital cockpit, and ADAS/AD; and IoT, including consumer electronic devices, industrial devices, and edge networking products. The QTL segment grants licenses or provides rights to use portions of its intellectual property portfolio, which include various patent rights useful in the manufacture and sale of wireless products comprising products implementing LTE, and/or OFDMA-based 5G products and derivatives; to use cellular standard-essential patents, including 3G, 4G and 5G for cellular devices. The QSI segment invests in early-stage companies in various industries, including 5G, artificial intelligence, automotive, consumer, enterprise, cloud, IoT, and extended reality, and investments, including non-marketable equity securities and, to a lesser extent, marketable equity securities, and convertible debt instruments. It also provides development, and other services and sells related products to the United States government agencies and their contractors. In addition, the company is also involved in Qualcomm government technologies and data center businesses. Further, it provides security and intelligence services for unmanaged networks through software-based network security solutions. QUALCOMM Incorporated was incorporated in 1985 and is headquartered in San Diego, California. Source: EODHD Key Stats

AI spending is accelerating in 2026. Learn how to read AI earnings, spot overhyped stocks and find companies converting AI investment into real profit.