Finding Balance as Global Liquidity Shifts: What Investors Should Watch

As markets move through late 2025 and into 2026, global liquidity conditions are changing in ways that are subtle, uneven and easy to overlook. This is not a dramatic collapse in liquidity, nor a return to crisis-era stress. Instead, it is a shift away from the unusually generous conditions of the post-pandemic years toward a more balanced, selective environment. For investors, understanding that shift matters more than many headlines suggest.
What Investors Mean by “Liquidity”
In simple terms, liquidity is about how easily money can move through the financial system. It reflects how available funding is, how willing lenders are to provide credit, and how readily investors can buy and sell assets without disrupting prices.
Interest rates influence the cost of money. Liquidity influences its availability. The two are related, but not the same. Rates can be stable while liquidity tightens, particularly if lenders become more cautious, balance sheets are constrained or capital is absorbed elsewhere.
Liquidity comes from multiple sources. Central banks play a role through balance sheet policies and lending facilities. Banks matter through their willingness and ability to lend. Investors matter through their appetite for risk and preference for cash versus assets. Governments matter through borrowing needs that compete for capital.
When all of these elements align, liquidity feels abundant. When they do not, liquidity becomes more selective, even if headline policy settings appear benign.
Why Liquidity Matters More Than It Sounds
Market commentary tends to focus on growth, inflation and interest rates. Liquidity rarely receives the same attention, yet it often explains why markets behave the way they do when the economic narrative appears unchanged. Strong earnings can struggle to lift equities if liquidity is tightening. Weak data can be shrugged off when liquidity is abundant.
Liquidity influences how sensitive markets are to information. In high-liquidity environments, capital is readily available, setbacks are forgiven quickly and risk assets are well supported. When liquidity becomes scarcer, investors demand higher compensation for risk, funding becomes more selective and asset prices can move sharply even in the absence of major news.
The current environment sits between those extremes. Liquidity is no longer expanding aggressively, but it has not disappeared. That nuance is important. Investors who treat liquidity as either “on” or “off” risk missing the more relevant question: where is liquidity becoming tighter, where is it holding up, and what does that mean for markets?
From Abundance to Balance: How the Backdrop Has Changed
The post-pandemic years were defined by extraordinary liquidity. Central banks expanded balance sheets aggressively, governments issued debt at scale and financial systems were flooded with cash. That environment supported asset prices, compressed volatility and reduced the penalty for risk-taking.
That phase has now passed. Central banks are no longer injecting liquidity at the same pace and, in some cases, are allowing balance sheets to contract. Governments remain active borrowers, but markets are increasingly required to absorb new issuance without the same degree of central bank support. Investors, meanwhile, have become more selective as returns on cash and low-risk assets have improved.
This shift does not imply an abrupt tightening or a systemic shortage of liquidity. Rather, it marks a transition toward balance. Capital remains available, but it is more price-sensitive and more discriminating. Markets that relied heavily on abundant liquidity for valuation support are more exposed, while those underpinned by strong cash flows and resilient balance sheets are better positioned.
Where Liquidity Is Shifting
Global liquidity is no longer expanding in a coordinated or uniform way. The extraordinary monetary accommodation that followed the pandemic is steadily giving way to a more neutral backdrop, as major central banks step back from balance sheet expansion and allow liquidity to normalise. This is not an abrupt tightening cycle, but a deliberate move away from the excesses of recent years toward conditions that are intended to be supportive without fuelling asset inflation or risk mispricing.
In the United States, the Federal Reserve has reduced its balance sheet meaningfully from its peak, withdrawing excess reserves from the financial system even as the pace of runoff has moderated. Europe has followed a similar path, with the European Central Bank allowing assets to mature without reinvestment and encouraging financial markets to operate with less reliance on central bank liquidity. Japan remains the most cautious, reflecting its long history of ultra-loose policy, but even there the direction has shifted away from incremental stimulus.
At the same time, global liquidity is increasingly shaped by divergence rather than synchronisation. Some central banks are closer to neutral settings, others remain focused on containing inflation, while several emerging markets have already moved toward easing to support domestic growth. This divergence means liquidity conditions are no longer defined by a single global cycle, but by relative policy stances, economic resilience and investor confidence across regions.
The result is a more fragmented liquidity environment. Capital is still available, but it is more selective, more price-sensitive and more responsive to regional differences than in the post-pandemic period. For markets, this increases the importance of understanding where liquidity is tightening, where it remains supportive, and how those shifts influence capital flows and asset pricing beneath the surface.
Australia’s Place in the Global Liquidity Cycle
Australia sits at the intersection of global capital flows rather than at their centre. As a small, open economy with deep financial markets, domestic liquidity conditions are heavily influenced by offshore funding markets and global investor sentiment. This means shifts in global liquidity often reach Australia faster and with greater intensity than in larger, more closed economies.
While the Reserve Bank of Australia plays an important role in setting domestic policy, Australian financial conditions are not determined in isolation. Local banks rely meaningfully on wholesale and offshore funding, making them sensitive to changes in global funding costs, US dollar liquidity and risk appetite. As a result, even modest tightening in global liquidity can flow through to higher funding costs, more conservative lending behaviour and changes in asset pricing, independent of moves by the RBA.
The Australian dollar acts as an important transmission mechanism in this process. Currency movements often reflect shifts in global liquidity and capital flows before those changes are fully evident in domestic economic data. Periods of global liquidity tightening tend to place downward pressure on the currency, cushioning the economy but also signalling tighter financial conditions beneath the surface.
For investors, this sensitivity reinforces the importance of viewing Australian assets through a global lens. Liquidity conditions offshore matter as much as domestic policy settings, shaping outcomes across equities, credit and property markets. Understanding Australia’s place in the global liquidity cycle helps explain why local markets can respond sharply to changes in global conditions, even when the domestic economic narrative appears relatively stable.
What Shifting Liquidity Means for Markets
Liquidity conditions shape how markets respond to information. In equities, liquidity influences valuations as much as earnings. When liquidity is abundant, investors are willing to pay more for future growth. When it tightens, valuation discipline returns and market leadership narrows toward companies with strong balance sheets and reliable cash flows.
This does not necessarily imply broad market weakness. Rather, it suggests greater differentiation. Some segments may struggle, while others prove resilient. Volatility can increase even in the absence of recessionary conditions, simply because markets become more sensitive to marginal changes in sentiment and funding.
In fixed income, reduced central bank support places greater emphasis on credit risk, issuance dynamics and investor demand. Yield levels may appear attractive, but spreads can widen if liquidity becomes constrained or risk appetite fades.
Real assets and alternatives face a similar tension. Long-term fundamentals may remain sound, but near-term performance can be influenced by funding availability and investor liquidity preferences.
What Investors Should Watch
Liquidity conditions tend to change slowly, but their market impact can be sudden. The goal for investors is not to track every data point, but to focus on a small number of signals that reveal whether capital is becoming more available or more constrained beneath the surface.
Central bank balance sheet trends remain a foundational indicator. Changes in asset holdings and reserve levels influence how much liquidity is available to support financial markets, even when policy rates appear stable. A slowing or reversal in balance sheet contraction can ease pressure on risk assets, while continued runoff tends to increase market sensitivity to shocks.
Money market fund flows provide insight into investor risk preferences.
Elevated allocations to cash-like instruments often reflect caution and a desire for liquidity, particularly in late-cycle environments. Persistent strength in these flows suggests capital is available, but not yet willing to move decisively into risk assets.
Short-term funding markets can reveal stress before it becomes visible elsewhere. Activity in repo markets and increased use of central bank facilities may signal emerging balance sheet constraints or funding pressures that are not captured by headline policy settings or economic data.
For Australian investors, domestic funding conditions are especially important. Bank funding spreads, offshore issuance costs and deposit competition offer timely insight into how global liquidity shifts are flowing through to the local financial system. These dynamics directly influence lending behaviour, mortgage pricing and broader credit availability.
Cross-border capital flows and currency movements often act as early warning signals. A stronger US dollar typically tightens financial conditions for non-US economies, including Australia, by increasing the cost of foreign funding and dampening risk appetite across markets.
Taken together, these signals help investors look beneath market headlines and better assess whether liquidity is becoming more supportive or more restrictive, often well before the impact is fully reflected in asset prices.
How Investors Can Think About Positioning
Liquidity analysis is not about timing markets. It is about understanding the environment in which decisions are being made. In a world where liquidity is no longer uniformly abundant, flexibility matters more than precision.
Balance sheet strength, cash flow resilience and funding durability become more valuable when liquidity is selective. Diversification across different liquidity regimes can be just as important as diversification across asset classes. Above all, liquidity should be viewed as a risk management lens rather than a short-term signal.
The post-pandemic era demonstrated how powerful abundant liquidity can be. The next phase is likely to reward investors who understand where liquidity is tightening, where it remains supportive and how that balance shapes market behaviour. In a more normalised world, that understanding may prove to be one of the most underappreciated sources of investment insight.
Subscribe to our newsletter
Disclaimer: This article does not constitute financial advice nor a recommendation to invest in the securities listed. The information presented is intended to be of a factual nature only. Past performance is not a reliable indicator of future performance. As always, do your own research and consider seeking financial, legal and taxation advice before investing.

Big Tech earnings could shake your portfolio this week. Understand how the latest results may influence global markets, the ASX and your investment strategy.

A second strategic chokepoint is under threat after Hormuz. Discover how the Bab al-Mandeb blockade could affect oil prices, inflation, interest rates and your portfolio.
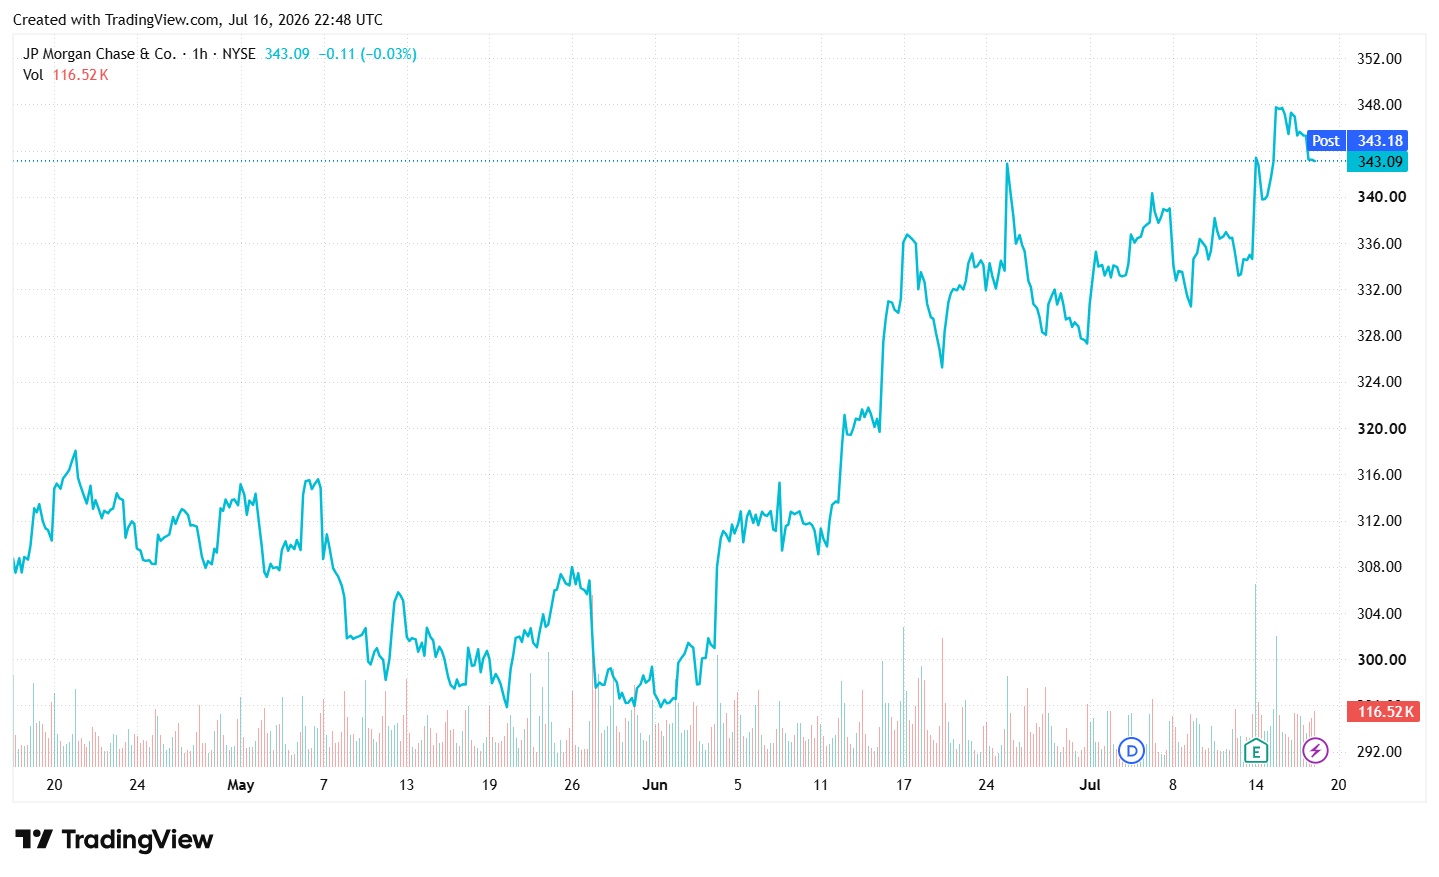
This week's Stock Spotlight is NYSE-listed JPMorgan Chase & Co. About JPMorgan Chase & Co. JPMorgan Chase & Co. operates as a bank and financial holding company in the United States, rest of North America, Europe, the Middle East, Africa, the Asia Pacific, Latin America, and the Caribbean. It operates in three segments: Consumer & Community Banking, Commercial & Investment Bank, and Asset & Wealth Management. The company offers deposit, investment and lending products, and cash management; mortgage origination and servicing activities; residential mortgages and home equity loans; and credit cards, payment solutions, travel services, merchant offers, lifestyle benefits, auto loans, and leases to consumers and small businesses through bank branches, ATMs, and digital and telephone banking. It also provides investment banking, market-making, financing, custody, and securities products and services; corporate strategy and structure advisory, equity and debt market capital-raising, and loan origination and syndication services; cash and derivative instruments, risk management solutions, prime brokerage, clearing, and research; and fund services, liquidity and trading services, and data solutions products for large corporations, financial institutions, merchants, start-ups, small and midsized companies, local governments, municipalities, nonprofits, and commercial real estate clients. In addition, the company offers multi-asset investment management solutions in equities, fixed income, alternatives, and money market funds to institutional clients and retail investors; retirement products and services, estate planning, lending, deposits, and investment management products to high-net-worth clients; and financial transaction processing. JPMorgan Chase & Co. was founded in 1799 and is headquartered in New York, New York. Source: EODHD Key Stats
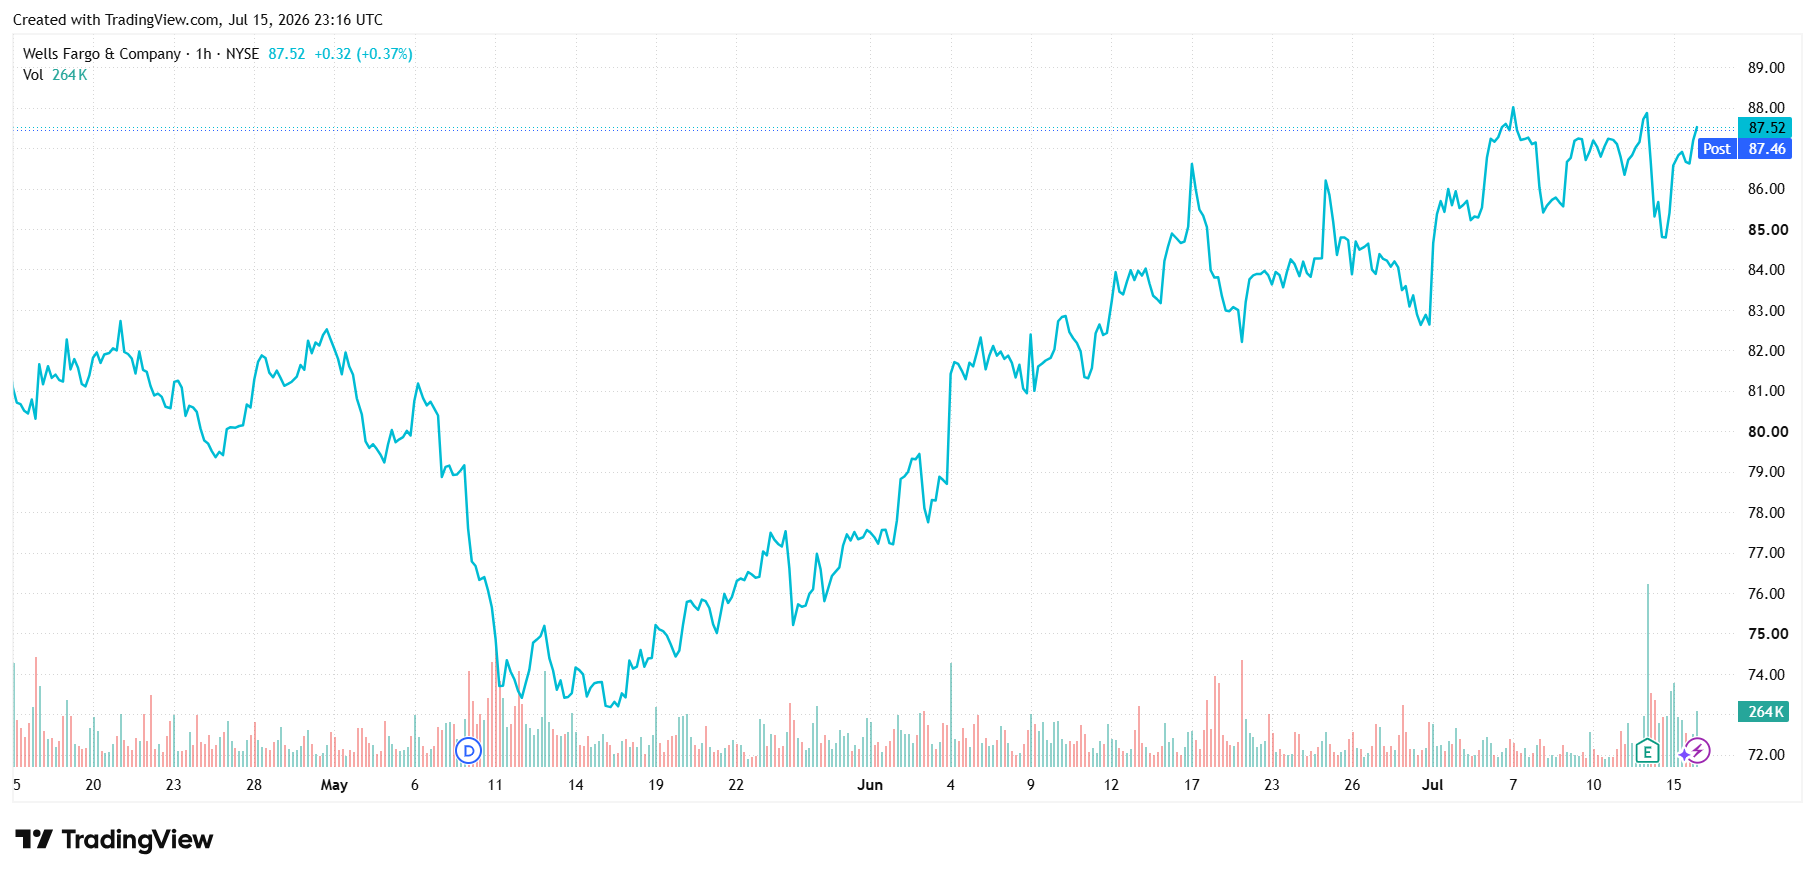
This week's Stock Spotlight is NYSE-listed Wells Fargo & Company. About Wells Fargo & Company. Wells Fargo & Company, a financial services company, provides diversified banking, investment, mortgage, and consumer and commercial finance products and services in the United States and internationally. It operates through four segments: Consumer Banking and Lending; Commercial Banking; Corporate and Investment Banking; and Wealth and Investment Management. The company's financial products and services includes checking and savings accounts, and credit and debit cards, as well as home, auto, personal, and small business lending services. It also provides personalized wealth management, brokerage, financial planning, lending, private banking, trust and fiduciary products and services; and financial solutions to private, family owned and public companies through products and services including banking and credit products across multiple industry sectors and municipalities, secured lending and lease products, and treasury management. In addition, it offers a suite of capital markets, banking, and financial products and services, such as corporate banking, investment banking, treasury management, commercial real estate lending and servicing, equity, and fixed income solutions, as well as sales, trading, and research capabilities services to corporate, commercial real estate, government, and institutional clients. Wells Fargo & Company was founded in 1852 and is headquartered in San Francisco, California. Source: EODHD Key Stats
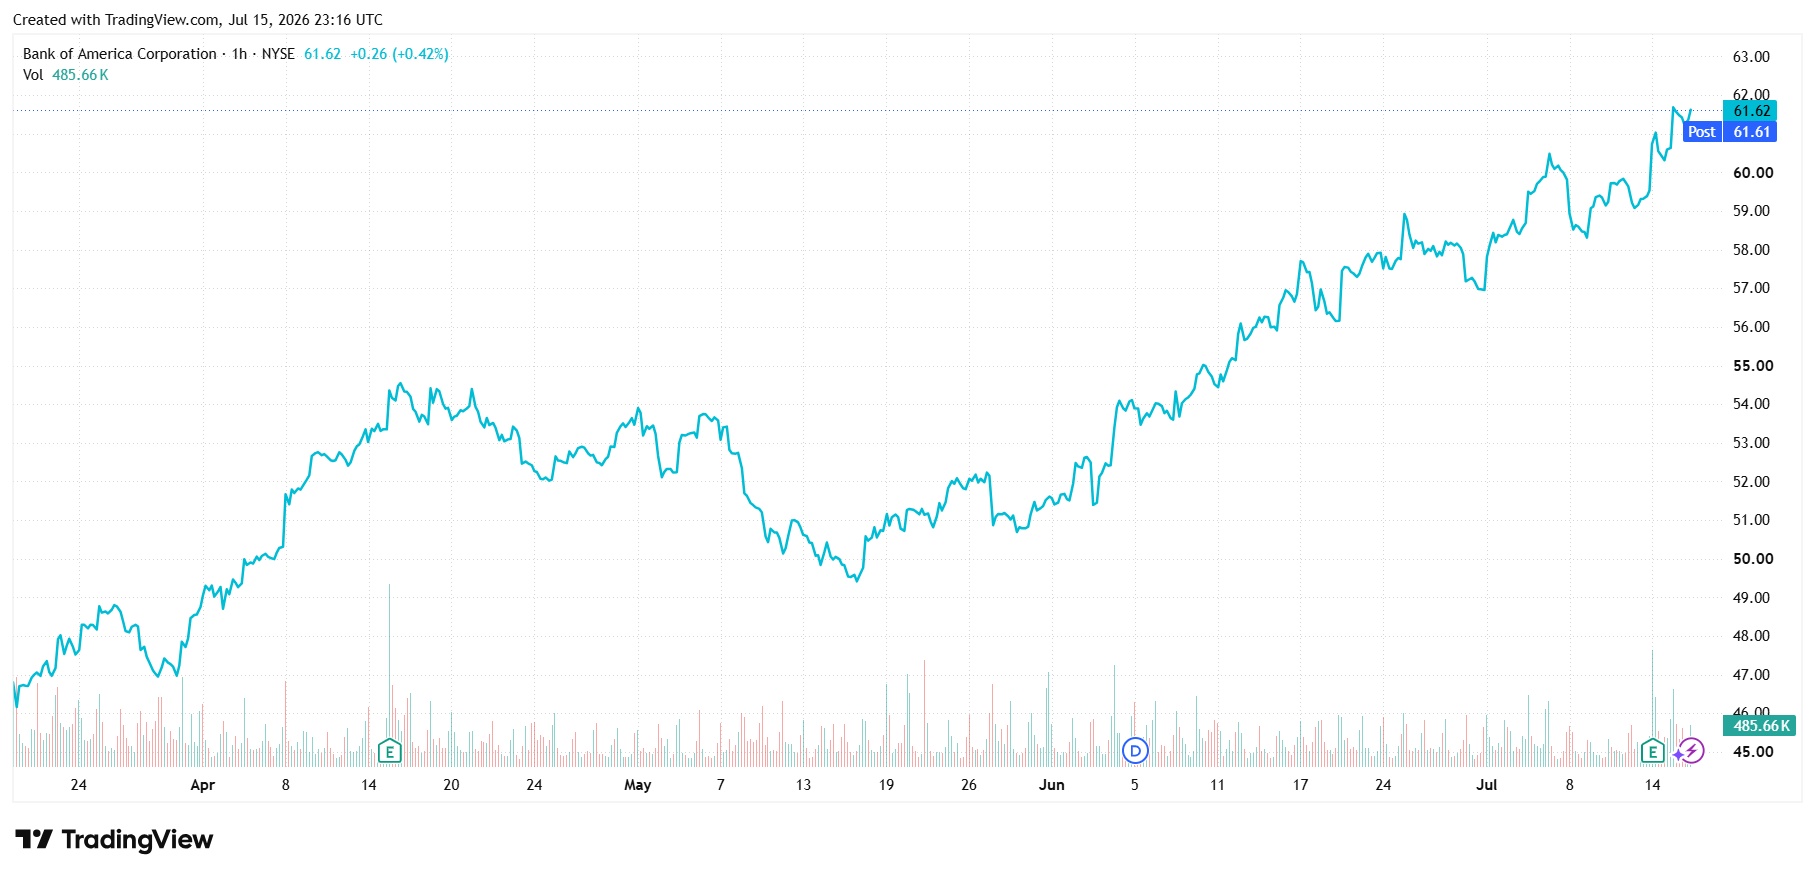
This week's Stock Spotlight is NYSE-listed Bank of America Corp. About Bank of America Corp. Bank of America Corporation, through its subsidiaries, provides various financial products and services for individual consumers, small and middle-market businesses, institutional investors, large corporations, and governments worldwide. It operates through four segments: Consumer Banking, Global Wealth & Investment Management (GWIM), Global Banking, and Global Markets. The Consumer Banking segment offers traditional and money market savings accounts, certificates of deposit and IRAs, checking accounts, and investment accounts and products; credit and debit cards; residential mortgages and home equity loans; and direct and indirect loans. The GWIM segment provides investment management, brokerage, banking, and trust and retirement products and services; wealth management solutions; and customized solutions, including specialty asset management services. The Global Banking segment offers lending products and services, including commercial loans, leases, commitment facilities, trade finance, and commercial real estate and asset-based lending; treasury solutions, and underwriting and advisory services. The Global Markets segment provides market-making, financing, securities clearing, settlement, and custody services; securities and derivative products; and risk management products using interest rate, equity, credit, currency and commodity derivatives, foreign exchange, fixed-income, and mortgage-related products. Bank of America Corporation was founded in 1784 and is based in Charlotte, North Carolina. Source: EODHD Key Stats
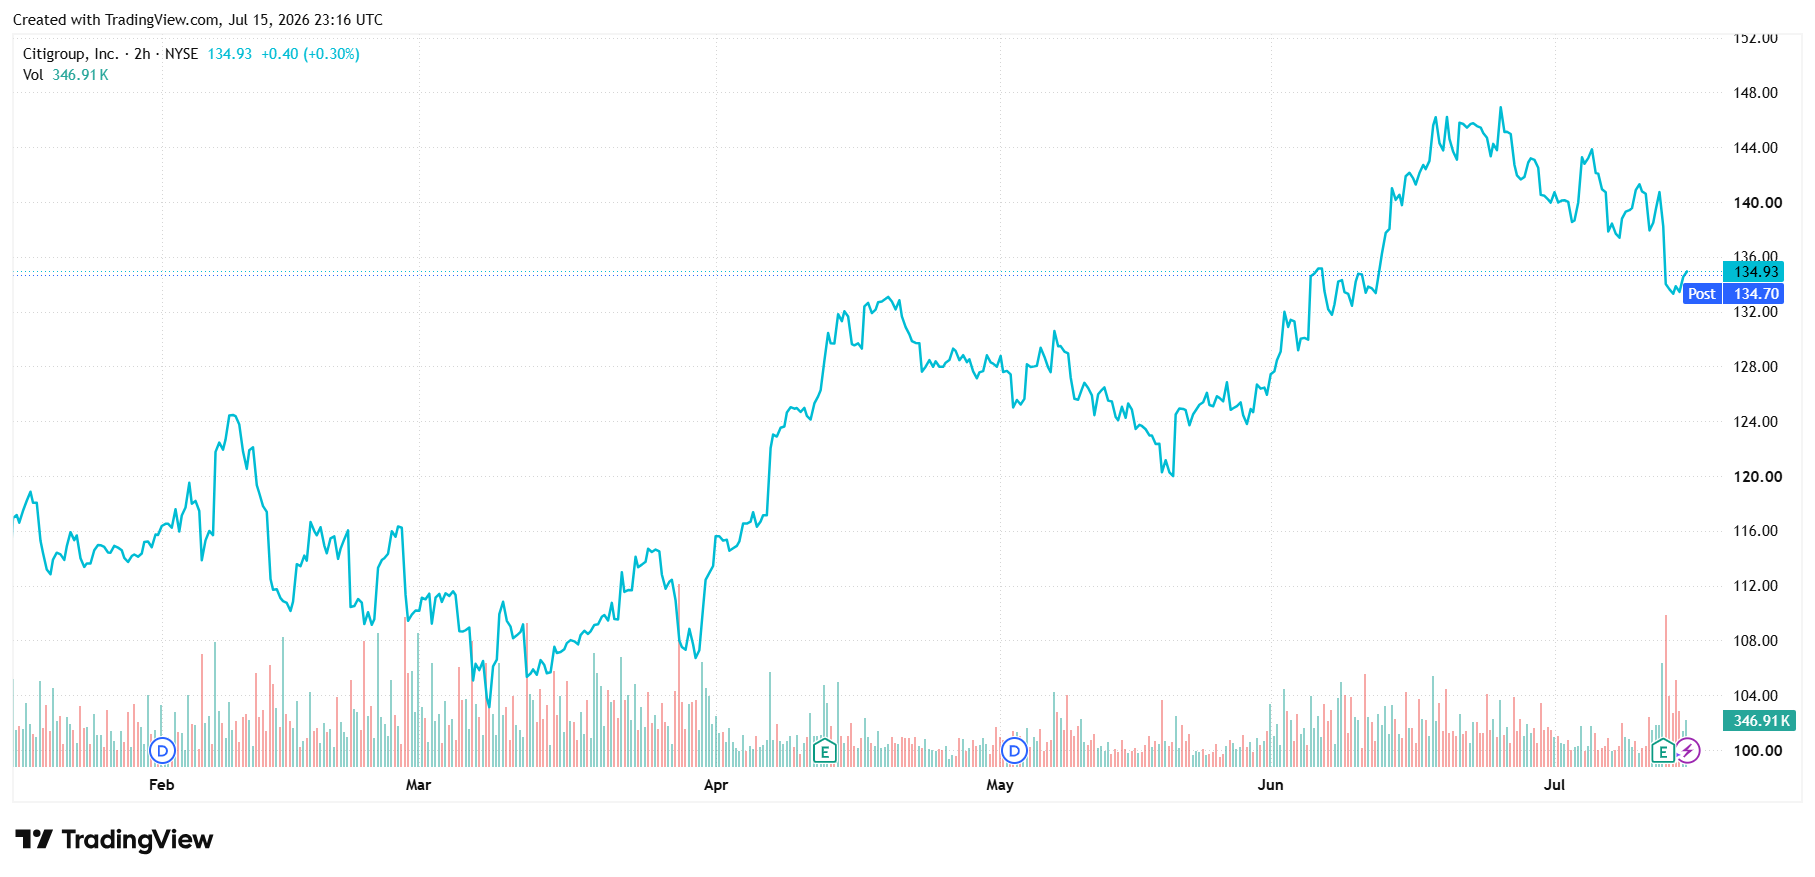
This week's Stock Spotlight is NYSE-listed Citigroup Inc. About Citigroup Inc. Citigroup Inc., a diversified financial service holding company, provides various financial products and services to consumers, corporations, governments, and institutions. It operates through five segments: Services, Markets, Banking, U.S. Personal Banking, and Wealth. The Services segment includes treasury and trade solutions, which provides cash management, trade, and working capital solutions to multinational corporations, financial institutions, and public sector organizations; and securities services, such as cross-border support for clients, local market expertise, post-trade technologies, data solutions, and various securities services solutions. The Markets segment offers sales and trading services for equities, foreign exchange, rates, spread products, and commodities to corporate, institutional, and public sector clients; and market-making services, including asset classes, risk management solutions, financing, and prime brokerage. The Banking segment includes investment banking services comprising equity and debt capital markets-related strategic financing solutions; advisory services related to mergers and acquisitions, divestitures, restructurings, and corporate defense activities; and corporate lending consists of corporate and commercial banking. The U.S. Personal Banking segment provides proprietary and co-branded card portfolios; and traditional banking services to retail and small business customers. The Wealth segment offers financial services to high-net-worth clients through banking, lending, mortgages, investment, custody, and trust product offerings; professional industries, including law firms, consulting groups, accounting, and asset management; and affluent and high net worth clients. The company operates in North America, the United Kingdom, Japan, North and South Asia, Australia, Europe, the Middle East, and Africa. Citigroup Inc. was founded in 1812 and is headquartered in New York, New York. Source: EODHD Key Stats

AI is driving unprecedented demand for data centres. Discover how the infrastructure powering AI is creating opportunities across energy, property and technology.
About Capstone Copper Corp. Capstone Copper Corp., a copper mining company, mines, explores for, and develops mineral properties in the United States, Chile, and Mexico. The company primarily explores copper, silver, gold, molybdenum, zinc, iron, cobalt, and other base metals. Capstone Copper Corp. is headquartered in Vancouver, Canada. Source: EODHD Key Stats
About Qualcomm Inc. QUALCOMM Incorporated engages in the development and commercialization of foundational technologies for the wireless industry worldwide. It operates through three segments: Qualcomm CDMA Technologies (QCT); Qualcomm Technology Licensing (QTL); and Qualcomm Strategic Initiatives (QSI). The QCT segment develops and supplies integrated circuits and system software with connectivity and computing technologies for use in mobile devices; automotive systems for connectivity, digital cockpit, and ADAS/AD; and IoT, including consumer electronic devices, industrial devices, and edge networking products. The QTL segment grants licenses or provides rights to use portions of its intellectual property portfolio, which include various patent rights useful in the manufacture and sale of wireless products comprising products implementing LTE, and/or OFDMA-based 5G products and derivatives; to use cellular standard-essential patents, including 3G, 4G and 5G for cellular devices. The QSI segment invests in early-stage companies in various industries, including 5G, artificial intelligence, automotive, consumer, enterprise, cloud, IoT, and extended reality, and investments, including non-marketable equity securities and, to a lesser extent, marketable equity securities, and convertible debt instruments. It also provides development, and other services and sells related products to the United States government agencies and their contractors. In addition, the company is also involved in Qualcomm government technologies and data center businesses. Further, it provides security and intelligence services for unmanaged networks through software-based network security solutions. QUALCOMM Incorporated was incorporated in 1985 and is headquartered in San Diego, California. Source: EODHD Key Stats

AI spending is accelerating in 2026. Learn how to read AI earnings, spot overhyped stocks and find companies converting AI investment into real profit.